Introduction
Today, sustainable development – development that meets the needs of the present without compromising the ability of future generations to meet their own needs1 – is at the centre of the global policy agenda, with the UN’s Sustainable Development Goals and the Paris Agreement establishing a common platform for international cooperation in the area of development and climate change. The three main pillars of sustainable development are economic growth, environmental protection and social equality.
This chapter looks at the extent to which environmental protection and economic growth go hand in hand and reinforce each other. The confluence of economic growth and environmental sustainability has become known as “green growth”. Green growth supports the creation of wealth, jobs and economic opportunities and contributes to rising living standards, while at the same time preserving natural resources and environmental public goods (such as clean air and water) for future generations. Many international organisations, including the EBRD, are now focused on achieving sustainable, green growth.
Progress on reducing GHG emissions
The EBRD region from a comparative perspective
The Paris Agreement on climate change calls for very aggressive reductions in GHG emissions – particularly CO2 emissions, which account for more than three-quarters of all GHG emissions worldwide. CO2 is released into the atmosphere through the burning of fossil fuels, solid waste, trees and wood products, and also as a result of certain chemical reactions (those occurring, for example, in the manufacturing of cement).
Since the start of the transition process, the EBRD region has witnessed substantial reductions in GHG emissions, whether emissions are measured in aggregate terms, on a per capita basis or per US dollar of GDP (see Chart 4.1). While this is encouraging, much more remains to be done. Although the region’s emissions per capita declined in the 1990s, reaching their lowest point in 2000, they have since increased again.
Today, many of the countries in the EBRD region are still among the most carbon-intensive in the world. The region’s GHG emissions per capita and per US dollar of GDP remain around 20 per cent higher than in comparator countries – emerging markets that are similar in terms of their populations and per capita incomes (see Chapter 1 for methodological details). This is despite the fact that GHG emissions per capita in comparator countries have been steadily rising since the early 1990s, in contrast with trends in the EBRD region.
Almost 80 per cent of all GHG emissions worldwide originate in the energy sector. There is, of course, significant variation across countries: rich countries’ emissions are largely dominated by power and transport, middle-income countries’ emissions are shaped by power and industry, and poor countries’ emissions stem largely from agriculture. In the EBRD region, the percentage of GHG emissions originating in the energy sector has been relatively stable at more than 70 per cent since the early 1990s. In comparator countries, by contrast, the energy sector’s contribution to emissions has gradually increased over that period, but it remained below the 70 per cent mark in 2013.
CO2 accounts for 94 per cent of all energy-related GHG emissions. In order to understand the trends in energy-related CO2 (![]() ), it is useful to break total emissions down into their three contributing factors: carbon intensity (carbon emissions per unit of energy), energy intensity (energy use per unit of GDP) and GDP:
), it is useful to break total emissions down into their three contributing factors: carbon intensity (carbon emissions per unit of energy), energy intensity (energy use per unit of GDP) and GDP:

As GDP rises, the carbon intensity of energy production and/or the energy intensity of output have to fall in order for overall carbon emissions to decline. The next two subsections analyse recent trends in carbon intensity and energy intensity.
Source: World Resources Institute (2017) and authors’ calculations.
Note: Data represent unweighted averages across countries. Comparator countries are emerging markets that are similar in terms of population size and income per capita (see Chapter 1 for details). “MtCO2e” stands for “million metric tonnes of carbon dioxide equivalent”.
Carbon intensity in the energy sector
The carbon intensity of the EBRD region’s energy sector has declined substantially since 1992 (see Chart 4.2). It remains below the level observed in 1992, despite an upward trend since 2009. In most countries, carbon intensity has either decreased since the early 1990s or remained more or less constant. In Mongolia, however, carbon intensity has more than doubled since 2008 as a result of a mining boom.
Source: WDI and authors’ calculations.
Note: Data represent unweighted averages across countries. Comparator countries are emerging markets that are similar in terms of population size and income per capita (see Chapter 1 for details).
Source: IEA data from World Energy Balances.7
Note: Data represent unweighted averages across countries. Comparator countries are emerging markets that are similar in terms of population size and income per capita (see Chapter 1 for details).
Energy intensity of GDP
The energy intensity of GDP is determined largely by the sectoral structure of each economy and the amount of energy that is used to produce a unit of value added in each industry (which reflects the energy efficiency of the various industries), alongside other factors such as weather conditions and the standard of living.
Central planning led to both distortions in the sectoral structure of economies and intrinsic inefficiencies in the use of energy. Consequently, reductions in energy intensity can be traced back to structural changes (shifts towards less energy-intensive economic activities, such as services) and improvements in energy efficiency following the start of the transition process.
Source: WDI and authors’ calculations.
Note: Data represent unweighted averages across countries. Comparator countries are emerging markets that are similar in terms of population size and income per capita (see Chapter 1 for details).
Management and energy intensity: the role of energy subsidies
When it comes to energy-efficient production structures, firms’ choices are influenced by their countries’ energy policies. Several countries in the EBRD region that are heavily reliant on fossil fuels for their energy supply subsidise fossil fuels and electricity generated from fossil fuels. With the exception of Cyprus, no countries in the region take account of costs associated with global warming, local externalities or forgone consumption tax revenues when setting energy prices (see Chart 4.5). This is a key policy distortion that makes fossil fuels (and electricity generated from them) cheaper for both households and firms, in turn affecting behaviour in terms of energy usage. According to the IMF, the EBRD region’s fossil fuel subsidies had a total value (excluding tax treatment) of US$ 112 billion in 2013 (equivalent to 1.7 per cent of the region’s GDP), while subsidies including tax treatment totalled US$ 699 billion (11.7 per cent of GDP).11
Source: IMF Energy Subsidies Template and authors’ calculations.
Note: These estimates relate to 2013 and include both consumption and production-related subsidies (inclusive of tax treatment). No data are available for Kosovo.
Source: IMF, BEEPS V, MENA ES and authors’ calculations.
Note: This chart reports the impact associated with improving the quality of management from the 25th to the 75th percentile of the distribution of management scores. Energy intensity is calculated as the energy cost per US dollar of sales, based on energy-intensive manufacturing industries only (see Box 4.2 for details). Solid bars denote estimates that are statistically significant at the 10 per cent level or higher.
The characteristics of green firms and their performance
Firms can reduce production-related emissions by manufacturing goods in a more environmentally friendly manner or by shifting production in favour of products and services that are better for the environment. For the economy to grow sustainably, resources need to be reallocated from less productive “dirty” firms to more productive green firms, as discussed in Chapter 2. While there are few studies looking at the impact that environmentally friendly goods have on firms’ performance levels, the impact of environmentally friendly production methods has been studied extensively.13 However, evidence for the EBRD region is scarce in both areas. This section aims to at least partially fill that gap.
Green production
This subsection investigates the link between environmentally friendly production methods and firms’ performance levels using data from the survey carried out by Anderson et al. (2011). That survey, which consisted of almost 800 telephone interviews with managers of manufacturing plants and addressed a variety of climate change-related topics, covered Hungary and Poland, as well as Belgium, France, Germany and the United Kingdom.
Source: Martin et al. (2017).
Note: Figures in parentheses denote the number of respondent firms per country. Average z-scores are obtained by regressing CFI scores on a set of country dummy variables, controlling for three-digit industry fixed effects, as well as various interview characteristics, and measuring the deviation of a country’s coefficient from the average across all country coefficients. The differences for France and Poland are statistically significant at the 1 per cent level.
Panel A: Central Europe (Hungary and Poland)
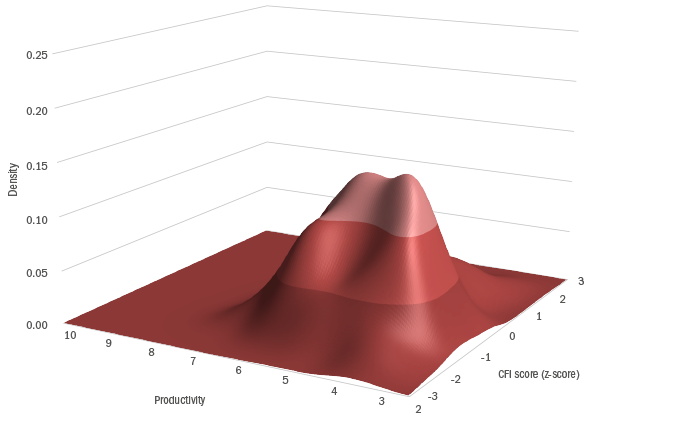
Panel B: Western Europe (Belgium, France, Germany and the United Kingdom)
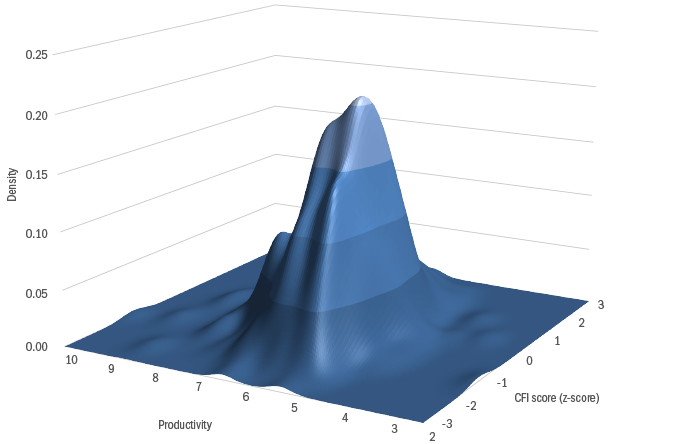
Source: Martin et al. (2017).
Note: Labour productivity is defined as the ratio of average turnover to average employment in the period 2006-10.
Source: Martin et al. (2017).
Note: See Box 4.3 for methodological details. All differences are statistically significant at the 10 per cent level or higher.
Source: Martin et al. (2017).
Note: Data represent standardised coefficients and are based on a regression estimated using ordinary least squares. All regressions include country and industry fixed effects (see Box 4.3 for details).
| (1) | (2) | |
|---|---|---|
| Dependent variable | Labour productivity (log) | |
| CFI | 0.079*** | 0.050* |
| (0.027) | (0.028) | |
| Poland/Hungary * CFI | 0.331** | |
| (0.160) | ||
| Observations | 715 | 715 |
| R2 | 0.6 | 0.61 |
Source: Martin et al. (2017).
Note: Estimated using ordinary least squares. Labour productivity is defined as the ratio of average turnover to average employment in the period 2006-10. All regressions include country and industry fixed effects (see Box 4.3 for details). Standard errors are shown in parentheses. *, ** and *** denote statistical significance at the 10, 5 and 1 per cent levels respectively.
Green revenue and trade
Having looked at how firms produce goods, this section now turns its attention to what they produce, looking specifically at products that help to mitigate, remediate or adapt to the negative consequences of climate change, resource depletion and environmental erosion. This subsection assesses the link between sales of green products and firms’ performance levels using FTSE Russell’s Low-Carbon Economy (LCE) database and Bureau van Dijk’s Orbis database. The LCE data define green products far more broadly than the title of that database might suggest (see Box 4.4 for details), with products ranging from flood barriers and electric cars to sustainably sourced crops.
Source: FTSE Russell’s LCE database, Bureau van Dijk’s Orbis database and authors’ calculations.
Note: Figures in parentheses denote the number of firms per industry.
Source: FTSE Russell’s LCE database, Bureau van Dijk’s Orbis database and authors’ calculations.
Note: Data represent simple averages across firms.
| Green revenue | |||
|---|---|---|---|
| None | Up to 50% | More than 50% | |
| Turnover (€ million) | 3,414 | 5,611 | 1,764 |
| Number of employees | 13,016 | 17,930 | 6,963 |
| Age of firm (years) | 35.1 | 51 | 26.9 |
| Number of firms | 6,125 | 484 | 216 |
SOURCE: FTSE Russell’s LCE database, Bureau van Dijk’s Orbis database and authors’ calculations.
Note: Data represent simple averages across firms.
| Dependent variable | (1) Turnover per employee (US dollars; log) |
(2) Return on equity (%) |
(3) Return on assets (%) |
(4) Turnover growth (%) |
|---|---|---|---|---|
| Firms with up to 50% green revenue | -0.082 | 0.623 | -0.492 | -9.284*** |
| (0.157) | (3.422) | (1.548) | (2.397) | |
| Firms with more than 50% green revenue | -0.367* | -6.006 | -3.667 | 9.387** |
| (0.219) | (5.338) | (2.404) | (4.595) | |
| Constant | 14.516*** | -6.105 | 1.314 | 27.285*** |
| (0.180) | (3.913) | (2.045) | (6.388) | |
| R2 | 0.39 | 0.10 | 0.10 | 0.16 |
| No. of observations | 47,793 | 47,802 | 47,802 | 41,264 |
| No. of firms | 8,583 | 8,585 | 8,585 | 8,504 |
SOURCE: FTSE Russell’s LCE database, Bureau van Dijk’s Orbis database and authors’ calculations.
Note: Estimated using ordinary least squares. All regressions take account of country, year and industry fixed effects, as well as firm age, firm age squared, the log of the number of employees, indicators of state ownership, the number of companies in the group, the number of shareholders and whether the firm is listed or delisted (as opposed to unlisted), as well as interaction terms for selected variables and green revenue categories. Robust standard errors, clustered at firm level, are indicated in parentheses. *, ** and *** denote statistical significance at the 10, 5 and 1 per cent levels respectively.
Future prospects for the green economy
While green revenue currently accounts for only a small percentage of firms’ total revenue, the green economy has substantial growth potential. Global trade in low-carbon goods and services probably already exceeds US$ 1 trillion (see Box 4.6), and it can be expected to increase substantially over the next few decades18 if the global decarbonisation objectives agreed under the Paris Agreement are pursued.
This raises the question of how well prepared the EBRD region is for the advent of the low-carbon economy. In order to answer that question, this section looks at countries’ ability to convert existing production processes to low-carbon equivalents and develop the new goods and services that a low carbon economy will demand.
Progress in the area of low-carbon innovation
One useful indicator of the potential for a shift to a low-carbon economy is the degree of low-carbon innovation, which indicates the effort that is currently being put into developing clean products and processes for the future. Low-carbon innovation can be measured using the number of clean patents filed in a country. The European Patent Office (EPO) has a widely used classification system which identifies technological innovations that seek to mitigate climate change, distinguishing between clean patents relating to the energy sector, transport, buildings and carbon capture.19
Source: EPO and authors’ calculations
Note: Only countries with more than 100 patents over this period are included here. “Top innovators” denotes the 20 countries with the highest total numbers of patents worldwide. See Chapter 1 for a definition of comparator countries.
Source: UN Comtrade database, EPO, UNIDO INDSTAT4 2017 ISIC Rev. 3 and authors’ calculations.
Note: For both the Green Innovation Index and revealed comparative advantage, a score of more than 1 signifies performance above the global average (see Box 4.7 for details). The size of each dot is proportionate to the relevant sector’s contribution to national GDP. This chart covers the 12 largest manufacturing sectors in each country (on the basis of gross value added) which have filed at least 30 patents (11 sectors in the case of Hungary). See Annex 4.1 for a list of sector codes.
A SWOT analysis of low-carbon competitiveness
In order to obtain a more comprehensive picture of the economic opportunities and threats arising from a transition to a low-carbon economy, countries’ performance in the area of low-carbon innovation can be compared with their current areas of comparative advantage. The interplay between low-carbon innovation and current comparative advantages helps to identify potential strengths, weaknesses, opportunities and threats (SWOTs) in individual countries and specific manufacturing sectors with meaningful levels of overall patenting activity (see Box 4.7 for methodological details and Annex 4.1 for a list of industries). Chart 4.14 presents the results of this SWOT analysis for the six countries in the EBRD region with the highest overall numbers of patents.
Conclusion
At the start of the transition process, the EBRD region was an outlier relative to comparator countries with similar levels of development, not only in terms of its industrial structure, but also in terms of the amount of GHG emissions that resulted from it. Encouragingly, aggregate GHG emissions have fallen since the 1990s, but they remain above the levels observed in equivalent comparator economies. Moreover, reductions in emissions have been driven primarily by increases in energy efficiency, rather than reductions in the carbon intensity of energy production. If the EBRD region is to unlock further reductions in emissions and meet its commitments under the Paris Agreement, its carbon intensity will need to fall considerably and its energy efficiency improvements will need to continue.
Putting economies on the path to green growth will require strong policies and strict implementation, starting with the elimination of energy subsidies and the introduction of reasonable carbon pricing. It will also require a strengthening of the institutional and regulatory frameworks for renewable energy. When electricity and fuel are subsidised, well-managed firms choose more energy intensive production structures, resulting in higher emissions. In contrast, when energy is appropriately priced, well-managed firms respond to price signals and reduce their emissions. Energy subsidies tend to be concentrated in countries that are heavily reliant on fossil fuels as a source of export revenue.
The transition to a green economy will be particularly challenging for the fossil fuel-rich countries where it may be necessary to adopt special policies in order to replace lost income (see Box 4.9). Meanwhile, other parts of the EBRD region are relatively well placed to achieve success in the low-carbon economy. There is evidence of green innovation in a number of areas, despite countries continuing to lag behind the technological frontier in terms of emissions, environmentally friendly production processes and the production of green goods.
While sales of green goods and services are still at a relatively low level, volumes are growing rapidly. Among publicly listed firms, green revenue is typically higher among smaller, younger firms. Firms with a large percentage of green revenue tend to be less profitable, partly because the business environment favours non-green products. The fact that such firms are in business is encouraging and suggests that investors expect higher future returns in this sector and put a premium on firms’ environmental performance.
Realising the region’s green growth potential will not be without challenges. It will require determined, far-sighted management and a willingness by the private sector to embrace the low-carbon economy. It will also require better policies on the part of governments. The private sector will look to governments to provide a business environment that is conducive to low-carbon investment. This should start with the removal of energy subsidies and the introduction of appropriate pricing of carbon emissions, but also include regulatory measures (such as efficiency standards) to encourage energy saving, policies to promote renewable energy, and the use of subsidies to promote low-carbon technology. In addition, more comprehensive social safety nets and retraining opportunities may be required in order to soften the structural impact of transition to a low-carbon economy. With the right policies in place, investment will start to flow to cleaner, more sustainable and more productive firms.
Box 4.1. Assessing “green transition”
The EBRD’s mandate is to foster sustainable market economies that are competitive, well governed, green, inclusive, resilient and integrated. With this in mind, a green index has been developed in order to quantify the performance of countries in the EBRD region in the area of “green transition”. In line with the EBRD’s operational strategy for green investment, this index comprises three equally weighted categories: mitigation of climate change, adaptation to climate change and other environmental areas.
Results
The results of this analysis reveal that even the best-performing countries worldwide are some distance from the overall frontier when scores are averaged across all areas of the green economy (see Chart 4.1.1). Sweden tops the list, achieving a relatively modest score of 7.5 out of 10. Thus, all countries need to make more effort to tackle environmental concerns, notably the high level of CO2 emissions.
Source: World Bank, IEA (see footnote 7), EIA, World Health Organization, World Resources Institute, International Carbon Action Partnership, IMF, OECD, EBRD, ND-GAIN, CGIAR, Waste Atlas, IUCN Red List of Threatened Species, United Nations Environment Programme, United Nations Statistical Division, National Geographic and authors’ calculations.
Note: In the case of Kosovo, data are not available for all underlying indicators.
Box 4.2. Energy intensity, management practices and energy subsidies
The relationship between energy intensity, the quality of management practices and the difference between the efficient energy price and its actual level can be estimated using ordinary least squares and survey-weighted observations on the basis of the following specification:22

where ![]() and
and ![]() denote energy expenditure and total sales respectively for firm
denote energy expenditure and total sales respectively for firm ![]() in country
in country ![]() . is measured as fuel expenditure, electricity expenditure or the total of the two.
. is measured as fuel expenditure, electricity expenditure or the total of the two. ![]() is the difference between the efficient price of fuel, electricity or total energy and its actual level.
is the difference between the efficient price of fuel, electricity or total energy and its actual level.
Efficient energy prices take account of the cost of supplying energy, as well as the estimated costs of any externalities arising from energy usage (such as global warming, local air pollution, road congestion, car accidents and damage to roads).23 The actual price of fuel is the average of gasoline, diesel, kerosene, coal and natural gas prices and is calculated per gigajoule of energy. If the efficient price exceeds the actual price, the difference is attributed to energy subsidies.
The variable of interest is the management practices score ![]() . Control variables include country (
. Control variables include country (![]() ) and sector (
) and sector (![]() ) fixed effects, firm-level characteristics (sales, capital, labour, age of firm, ownership structure, access to credit, whether the firm is a shareholding company with shares traded on the stock market, percentage of employees with a university degree, capacities utilised and self-generated electricity) and characteristics of the firm’s vicinity that could affect energy use (intensity of night lights and average January and July temperatures). The regression uses Taylor-linearised standard errors that account for survey stratification.
) fixed effects, firm-level characteristics (sales, capital, labour, age of firm, ownership structure, access to credit, whether the firm is a shareholding company with shares traded on the stock market, percentage of employees with a university degree, capacities utilised and self-generated electricity) and characteristics of the firm’s vicinity that could affect energy use (intensity of night lights and average January and July temperatures). The regression uses Taylor-linearised standard errors that account for survey stratification.
This analysis focuses on highly energy-intensive manufacturing industries (which are more likely to benefit from energy subsidies), looking at textiles, paper and paper products, coke and refined petroleum products, chemical products, non-metallic mineral products and basic metals.24
The focus is on coefficient ![]() , which indicates the relationship between management practices and firms’ energy intensity with subsidies at different price-gap levels. Chart 4.6 indicates the economic impact of this coefficient for a hypothetical firm with energy intensity equal to the sample mean, reporting the estimated change in the firm’s energy intensity in the event of its management score improving from the 25th to the 75th percentile of the distribution of management quality.
, which indicates the relationship between management practices and firms’ energy intensity with subsidies at different price-gap levels. Chart 4.6 indicates the economic impact of this coefficient for a hypothetical firm with energy intensity equal to the sample mean, reporting the estimated change in the firm’s energy intensity in the event of its management score improving from the 25th to the 75th percentile of the distribution of management quality.
Box 4.3. Assessing firms’ green credentials
As part of the survey carried out by Anderson et al. (2011), almost 800 telephone interviews were conducted with managers of manufacturing plants in Belgium, France, Germany, Hungary, Poland and the United Kingdom between late August and early November 2009. That survey covered a variety of topics, including competition and other external drivers of climate change-related management practices, as well as specific measures adopted by firms in order to reduce energy consumption and GHG emissions. On the basis of the managers’ responses, a Climate-Friendliness Index (CFI) can be constructed in order to measure each firm’s green credentials.
Measuring firms’ green credentials
That CFI covers four areas: targets and monitoring, innovation, barriers to energy investment, and the adoption of energy-saving measures. The targets and monitoring questions focus on the scope and frequency of the firm’s monitoring of energy usage and GHG emissions, the types of energy and emissions targets that are in place at management level and the extent to which they are realistic, and the enforcement of those targets (including financial consequences in the event of their achievement or non-achievement).
Box 4.4. FTSE Russell’s LCE database: a description and analysis
Data
FTSE Russell’s LCE database consists of 11,789 publicly listed firms in 63 countries (including 213 publicly listed firms in seven EBRD countries)25 and covers the period from 2009 to 2015. For each firm, FTSE Russell provides information on the percentage of revenue that is “green”.
Revenue is deemed to be green where it is generated by goods or services that help to mitigate, remediate or adapt to the effects of climate change, resource depletion or environmental erosion. For example, flood barriers are a green product that helps to prevent flooding caused by increased rainfall. Such products are categorised on the basis of the LCE Industrial Classification System, which consists of eight LCE sectors (such as energy generation) and 60 subsectors (such as biofuels). For a number of firms (more than 15 per cent of all companies in the database), it is not possible to put a precise figure on the percentage of revenue that is deemed to be green. Instead, a range is indicated, with minimum and maximum values being provided. The analysis in this chapter employs a conservative approach and focuses on minimum green revenue shares.
Analysis
For the purposes of the analysis in this chapter, the LCE database is combined with firm-level information from Bureau van Dijk’s Orbis database, whereby only observations including information on green revenue, turnover, numbers of employees, profit measures and industry classification are included. This results in a sample comprising 7,221 firms from 59 countries (including 100 firms in seven EBRD countries).
The relationship between firms’ performance levels and green revenue shares is estimated using ordinary least squares on the basis of the following main specification:

where ![]() is the outcome variable of interest for firm
is the outcome variable of interest for firm ![]() in sector
in sector ![]() and country
and country ![]() in year
in year ![]() ,
, ![]() denotes green revenue shares that are greater than zero and less than 50 per cent, and
denotes green revenue shares that are greater than zero and less than 50 per cent, and ![]() denotes green revenue shares that are greater than 50 per cent. Firm-level control variables for age, age squared and the log of the number of employees and indicators of national, state or local government ownership (
denotes green revenue shares that are greater than 50 per cent. Firm-level control variables for age, age squared and the log of the number of employees and indicators of national, state or local government ownership (![]() ) are interacted with green revenue shares.
) are interacted with green revenue shares. ![]() is a matrix of other control variables, including the number of companies in the group, the number of shareholders, and whether the firm is listed or delisted (as opposed to unlisted).
is a matrix of other control variables, including the number of companies in the group, the number of shareholders, and whether the firm is listed or delisted (as opposed to unlisted). ![]() ,
, ![]() and
and ![]() are sector, country and year fixed effects, and
are sector, country and year fixed effects, and ![]() is the error term. Standard errors are robust and clustered by firm.
is the error term. Standard errors are robust and clustered by firm.
There are a number of caveats that need to be borne in mind here. First of all, the sample is not nationally representative, as the FTSE Russell LCE database focuses on gathering information on the world’s largest firms in term of market capitalisation. Thus, only very large firms are included, and the majority of those firms are from China, Japan, the United Kingdom and the United States of America, which together account for more than 70 per cent of the sample. Second, the sample includes only 100 firms from the EBRD region, limiting the conclusions that can be drawn from this analysis. Lastly, because the analysis focuses on minimum green revenue shares, the results can be interpreted as lower-bound estimates. The results are qualitatively similar if mean or maximum green revenue shares are used instead.
Box 4.5. Financial development and industrial pollution
Growing financial systems tend to have a positive, causal impact on long-term economic growth26 and may, therefore, also influence pollution levels. As discussed in Chapter 1, pollution increases at early stages of development, but declines once a country reaches a certain income level.27 As countries get richer, voters may, for instance, start to demand stricter anti-pollution legislation. How do the growth and structure of the financial system shape this relationship between economic growth and carbon emissions?
Source: De Haas and Popov (2017).
Note: Financial indicators are averaged over the period 1974-2013. “Bank credit” refers to credit to the private sector and excludes credit issued by central banks and cross-claims by one group of intermediaries against another.
Box 4.6. Trade in environmental goods
The diffusion of advanced and clean technology and services – also called “environmental goods and services” – will be key to achieving greener growth around the world. Trade barriers hinder access to such green goods and services and increase their cost for importing countries, thereby hampering the adoption of advanced green technology. Trade barriers can take many forms, including tariffs imposed on imports, as well as non-tariff barriers such as quotas, certification rules and local content requirements. While tariff barriers on many environmental products are moderate, non-tariff barriers are much higher.29 In some countries, total barriers are as high as 40 per cent (when expressed in tariff-equivalent units), thereby limiting opportunities for a structural shift towards greener growth.
Source: UN Comtrade and authors’ calculations.
Box 4.7. Measuring drivers of the low-carbon economy
There are three leading indicators that may predict drivers of the low-carbon economy.31
The first is the Green Innovation Index (![]() ), which is defined as green (clean) patents as a percentage of total patents in a given country and sector, relative to the percentage of green patents in that sector at global level. Formally, this is expressed as,
), which is defined as green (clean) patents as a percentage of total patents in a given country and sector, relative to the percentage of green patents in that sector at global level. Formally, this is expressed as,

where ![]() is the number of clean patents and
is the number of clean patents and ![]() is the total number of patents in sector and country (based on EPO data). Higher GII scores indicate a larger percentage of clean innovation in a given sector relative to other countries, and thus a more rapid conversion from conventional to clean production.
is the total number of patents in sector and country (based on EPO data). Higher GII scores indicate a larger percentage of clean innovation in a given sector relative to other countries, and thus a more rapid conversion from conventional to clean production.
The second indicator is a sector’s revealed comparative advantage (![]() ), which is defined as that sector’s share in the total exports of the country, divided by that sector’s share in global exports. This is expressed as
), which is defined as that sector’s share in the total exports of the country, divided by that sector’s share in global exports. This is expressed as

where ![]() is the volume of exports from sector
is the volume of exports from sector ![]() in country
in country ![]() (based on UN Comtrade data). A larger relative share in exports means that a sector has a greater RCA and is more competitive.
(based on UN Comtrade data). A larger relative share in exports means that a sector has a greater RCA and is more competitive.
The third and final indicator is green production at the outset, which is correlated with – and therefore measured using – total production in the relevant sector today, based on UNIDO data (INDSTAT4 2017, ISIC Rev. 3).
Box 4.8. Green complexity and green competitiveness
Countries tend to develop new products and industries in areas where they already have a comparative advantage. In other words, future production capabilities are strongly dependent on existing industrial structures. The Economic Complexity Index (ECI)32 measures the diversity and complexity of economies’ productive capabilities on the basis of what countries export. In a similar vein, the Green Complexity Index (GCI)33 assesses the diversity and complexity of countries’ green exports, indicating the countries that are currently best placed to become leaders in the green economy.
- Other
- EBRD region
- 45-degree line
Source: Mealy and Teytelboym (2017).
Box 4.9. Fiscal consequences of green transition for countries that export fossil fuels
The exact shape and pace of a country’s transition to a green economy is uncertain and will depend on the country’s development trajectory, the government’s policy responses and the availability of technology. (Services tend to be less energy-intensive than industry, for instance.) What is certain, however, is that transition to a green economy – combined with an increase in the use of renewable energy and higher levels of energy efficiency – will influence the price of fossil fuels and the value of related assets. If global prices cease to allow for the recovery of costs, many fossil fuel assets could become “stranded” – a situation that could lead to the unanticipated closure of production and the devaluation of assets, with assets potentially becoming net liabilities.34
Annex 4.1. ISIC Rev. 3 three-digit industry classification
| Code | Description | Code | Description |
|---|---|---|---|
| 151 | Processing/preserving of meat, fish, fruit, vegetables, oils and fats | 292 | Special-purpose machinery |
| 154 | Other food products | 293 | Domestic appliances |
| 171 | Spinning, weaving and finishing of textiles | 311 | Electric motors, generators and transformers |
| 172 | Other textiles | 312 | Electricity distribution and control apparatus |
| 181 | Wearing apparel, except fur apparel | 319 | Other electrical equipment |
| 232 | Refined petroleum products | 321 | Electronic valves and tubes and other electronic components |
| 241 | Basic chemicals | 323 | TV and radio receivers and associated goods |
| 242 | Other chemical products | 331 | Medical appliances/instruments, measuring/testing/navigating appliances |
| 252 | Plastics products | 341 | Motor vehicles |
| 269 | Non-metallic mineral products | 343 | Parts/accessories for automobiles |
| 271 | Basic iron and steel | 351 | Building and repairing of ships and boats |
| 272 | Basic precious and non-ferrous metals | 352 | Railway/tramway locomotives and rolling stock |
| 281 | Structural metal products, tanks, reservoirs and steam generators | 353 | Aircraft and spacecraft |
| 289 | Other fabricated metal products; metalworking service activities | 361 | Furniture |
| 291 | General-purpose machinery | 369 | Manufacturing |
SOURCE: UN Statistics Division (https://unstats.un.org/unsd/cr/registry/regcst.asp?Cl=2).
References
A. Al-Ghandoor (2012)
“Analysis of Jordan’s industrial energy intensity and potential mitigations of energy and GHGs emissions”, Renewable & Sustainable Energy Reviews, Vol. 16, pp. 4479-4490.
S. Ambec and P. Barla (2006)
“Can environmental regulations be good for business? An assessment of the Porter hypothesis”, Energy Studies Review, Vol. 14, pp. 42-62.
B. Anderson, J. Leib, R. Martin, M. McGuigan, M. Muûls, L. de Preux and U.J. Wagner (2011)
“Climate change policy and business in Europe: Evidence from interviewing managers”, Centre for Economic Performance Occasional Paper No. 27, March.
A. Ansar, B. Caldecott and J. Tilbury (2013)
“Stranded assets and the fossil fuel divestment campaign: what does divestment mean for the valuation of fossil fuel assets?”, Smith School of Enterprise and the Environment, University of Oxford.
N. Bloom, C. Genakos, R. Martin and R. Sadun (2010)
“Modern management: good for the environment or just hot air?”, Economic Journal, Vol. 120, pp. 551-572.
A. Bowen (2015)
“Carbon pricing: How best to use the revenue?”, Grantham Research Institute on Climate Change and the Environment and Global Green Growth Institute.
A. Bowen and S. Fankhauser (2011)
“The green growth narrative: Paradigm shift or just spin?”, Global Environmental Change, Vol. 21, pp. 1157-1159.
D. Coady, I. Parry, L. Sears and B. Shang (2017)
“How large are global fossil fuel subsidies?”, World Development, Vol. 91, pp. 11-27.
S. Dasgupta, B. Laplante, H. Wang and D. Wheeler (2002)
“Confronting the environmental Kuznets curve”, Journal of Economic Perspectives, Vol. 16, pp. 147 168.
R. De Haas and A. Popov (2017)
“Finance and pollution”, EBRD Working Paper, forthcoming.
EBRD (2011)
Special Report on Climate Change: The Low Carbon Transition, London.
EBRD (2014)
Transition Report 2014 – Innovation in Transition, London.
EBRD (2015)
Government assets: Risks and opportunities in a changing climate policy landscape. Methodology for calculating exposure under alternative policy scenarios, London.
EBRD (2017)
Kazakhstan diagnostic paper: Assessing progress and challenges in developing sustainable market economy, London.
EBRD, EIB and World Bank (2016)
What’s Holding Back the Private Sector in MENA? Lessons from the Enterprise Survey.
J. Endrikat, E. Guenther and H. Hoppe (2014)
“Making sense of conflicting empirical findings: A meta-analytic review of the relationship between corporate environmental and financial performance”, European Management Journal, Vol. 32, pp. 735-751.
S. Fankhauser, A. Bowen, R. Calel, A. Dechezleprêtre, D. Grover, J. Rydge and M. Sato (2013)
“Who will win the green race? In search of environmental competitiveness and innovation”, Global Environmental Change, Vol. 23, pp. 902-913.
G. Friede, T. Busch and A. Bassen (2015)
“ESG and financial performance: aggregated evidence from more than 2000 empirical studies”, Journal of Sustainable Finance & Investment, Vol. 5, pp. 210-233.
R. Hausmann, C.A. Hidalgo, S. Bustos, M. Coscia, S. Chung, J. Jimenez, A. Simoes and M.A. Yıldırım (2014)
The atlas of economic complexity: Mapping paths to prosperity, MIT Press, Cambridge, MA.
H. Haydock, A. McCullough, C. Nuttall, L. Evans, A.-L. Kaar, E. Bonifazi, R. Sibille, M. Houghton and S. Nair (2017)
UK business opportunities of moving to a low carbon economy, Ricardo Energy & Environment.
M. Kojima (2016)
“Fossil fuel subsidy and pricing policies: Recent developing country experience”, World Bank Policy Research Working Paper No. 7531.
R. Martin, M. Muûls, L. de Preux, H. Schweiger and U.J. Wagner (2017)
“Firms and the environment: Is there a difference between Eastern and Western Europe?”, mimeo.
P. Mealy and A. Teytelboym (2017)
“Economic complexity and the green economy”, mimeo, 4 September.
M. Nachmany, S. Fankhauser, J. Setzer and A. Averchenkova (2017)
Global trends in climate change legislation and litigation: 2017 update.
D. Nelson, M. Hervé-Mignucci, A. Goggins, S.J. Szambelan, T. Vladeck and J. Zuckerman (2014)
Moving to a low-carbon economy: The impact of policy pathways on fossil fuel asset values, Climate Policy Initiative Energy Transition Series.
OECD (2017)
Investing in Climate, Investing in Growth, Paris.
A. Popov (2017)
“Evidence on finance and economic growth”, in T. Beck and R. Levine (eds.), The Handbook on Finance and Development, Edward Elgar Publishing.
J. Sauvage (2014)
“The Stringency of Environmental Regulations and Trade in Environmental Goods”, OECD Trade and Environment Working Paper No. 2014/03.
H. Schweiger and A. Stepanov (2017)
“Energy subsidies, energy intensity and management practices”, mimeo.
The New Climate Economy (2014)
Better Growth, Better Climate.
C. Trumpp and T. Guenther (2017)
“Too little or too much? Exploring U-shaped relationships between corporate environmental performance and corporate financial performance”, Business Strategy and the Environment, Vol. 26, pp. 49-68.
S. Upadhyaya (2010)
Compilation of energy statistics for economic analysis, UNIDO.
R. Veugelers and H. Schweiger (2016)
“Innovation policies in transition countries: one size fits all?”, Economic Change and Restructuring, Vol. 49, pp. 241-267.
World Commission on Environment and Development (1987)
Our Common Future, Oxford University Press, Oxford.
World Resources Institute (2017)
CAIT Country GHG Emissions dataset (available at: cait.wri.org/historic).
Subscribe to the EBRD Transition Report 2017-18 mailing list.
Sign up to receive important announcements and emails about the Transition Report.