Introduction
Infrastructure networks provide a platform for economic activity. The generation and distribution of electricity powers industry and homes; water and sanitation facilities make environments liveable and deliver health; information and communication technology (ICT) knits businesses and communities together; and roads and railways physically connect markets and people, both within countries and across borders. High-quality infrastructure helps to allocate resources efficiently, making people and firms more productive,1 while a lack of infrastructure hinders productivity growth.
Infrastructure stock
The EBRD region boasts a number of sectors where access to infrastructure is, on average, similar to that seen in advanced economies. Access to electricity, for example, has been comparable to that observed in western Europe since at least 2004. In 2014, that access rate stood at 86 per cent in Mongolia and 92 per cent in Morocco, with other countries enjoying rates of almost 100 per cent, according to the World Bank. Similarly, most countries in the EBRD region enjoy access to safe water, although access rates are lower in the West Bank and Gaza (61 per cent),3 Mongolia (64 per cent) and Tajikistan (74 per cent). Access to high-quality sanitation facilities has risen across the region since 2005, although Moldova, Mongolia, Morocco, Romania and Russia continue to lag behind, with access rates of less than 80 per cent in 2014.
By the time countries achieve middle-income status, the quality of their core infrastructure (such as electricity, water, sanitation and roads) is often relatively high. However, such countries often find it difficult to improve their ICT and upgrade existing infrastructure (for example, when it comes to “greening” their energy supply, improving the reliability of energy provision and increasing the capacity of their road networks).4
Source: World Bank.
Lagging behind advanced economies
The EBRD region continues to lag behind advanced economies in terms of the overall quality of infrastructure, despite comparable access rates in certain sectors. While there are few reliable cross-country measures of the quality of infrastructure, available sources paint a consistent picture. The World Economic Forum’s Global Competitiveness Report conducts annual surveys of business leaders to measure the perceived quality of infrastructure around the world. The perceived quality of the EBRD region’s transport, electricity and communications infrastructure is very close to the global average, but substantially lower than the levels observed in advanced economies such as Japan, the United States of America and the EU-15 (see Chart 3.2).
Source: World Economic Forum and authors’ calculations.
Note: Scores are on a scale of one to seven, where higher numbers correspond to better infrastructure. Belarus, Kosovo, Turkmenistan and Uzbekistan are not included owing to insufficient data.
Source: World Bank.
Note: The index covers six areas: customs, infrastructure, international shipments, logistics competence, tracking and tracing, and timeliness. Data for Kosovo are not available.
Which infrastructure sectors are reported as being problematic by firms themselves?
The regular enterprise surveys conducted by the EBRD and the World Bank5 show that while electricity is generally less of a concern in the EBRD region relative to other emerging markets, firms in some individual countries (such as those in the SEMED region) still face major constraints in relation to electricity. Firms in Albania, Egypt, Kosovo, the Kyrgyz Republic, Lebanon, Tajikistan, Uzbekistan, and the West Bank and Gaza report losses of between 2 and 7 per cent of output owing to electricity outages, which represents a significant burden (see Chart 3.4). Recent major investments in Egypt have expanded the country’s generation capacity, reducing the frequency of such outages.
There is also considerable variation across the EBRD region in terms of the extent to which firms regard transport as a major constraint on their business. The West Bank and Gaza, Morocco, Kosovo and Romania all exceed, while Russia equals, the global average when it comes to transport-related constraints on firms (see Chart 3.5). An average of around 17 per cent of firms in the SEMED region report that transport represents a major constraint, compared with between 8 and 10 per cent in the SEE and CEB regions, eastern Europe and the Caucasus (EEC) and Central Asia. Overall, however, transport infrastructure in the EBRD region imposes fewer constraints on businesses than in other emerging markets.
Source: EBRD and World Bank enterprise surveys.
Note: Based on the 2013 survey or the latest available. Cyprus, Greece and Turkmenistan are not included owing to insufficient data.
Source: EBRD and World Bank enterprise surveys.
Note: Based on the 2013 survey or the latest available. Cyprus is not included owing to insufficient data.
Infrastructure investment: past and future
The availability of data on infrastructure investment is generally poor. A combination of inconsistent accounting methods for investment in public infrastructure across countries and irregular reporting of infrastructure investment (for both state-owned enterprises and private firms alike) makes it difficult to construct reliable measures of investment.
Source: OECD and authors’ calculations.
Estimating infrastructure investment needs
This section examines the EBRD region’s investment needs in the area of infrastructure over the next five years (that is to say, the period 2018-22). The estimates in this section capture the investment that is needed in order to bring the region’s infrastructure closer to levels consistent with those in advanced economies, support growth in populations and output, and replace ageing infrastructure lost to depreciation. These estimates are limited to network infrastructure – including roads and railways, electricity, water and sanitation facilities, broadband internet, landline telephone connections and mobile phones – and do not cover social infrastructure such as school buildings or hospitals.
Infrastructure investment needs in the EBRD region
The total investment needs of the EBRD region are estimated at €1.9 trillion.8 Bridging this gap over a five-year period will involve expenditure totalling approximately 9 per cent of the region’s GDP in each of those five years.9 The cost of catching up with the levels expected on the basis of the experiences of advanced comparator economies accounts for 52 per cent of that total, while improving infrastructure to support future growth in GDP and population figures over the next five years accounts for 15 per cent. The remaining 34 per cent relates to replacement and maintenance requirements over that same time period.
Source: WDI, IMF, US Energy Information Administration (EIA), Nunn and Puga (2012) and authors’ calculations.
Note: Data are expressed as a percentage of 2015 GDP figures, in 2010 prices. Estimates for Montenegro exclude the railway sector owing to insufficient data. Data are not available for Kosovo or Uzbekistan.
Source: WDI, IMF, EIA, Nunn and Puga (2012) and authors’ calculations.
Source: WDI, IMF, EIA, Nunn and Puga (2012) and authors’ calculations.
Note: Data are not available for Kosovo or Uzbekistan.
Source: WDI, IMF, EIA, Nunn and Puga (2012) and authors’ calculations.
Note: Data are not available for Kosovo or Uzbekistan.
Economic impact of upgrades to Turkish roads
Transport is the largest contributor to infrastructure investment in other parts of the world as well (see Chart 3.6). It plays a vital role in modern market economies, enabling the smooth functioning of global value chains, facilitating domestic and international trade and maintaining the economic rhythm of modern cities. This section examines the benefits that major upgrades to transport infrastructure can have in middle-income economies by looking at the case of Turkey, which undertook major public investment in roads during the 2000s.10
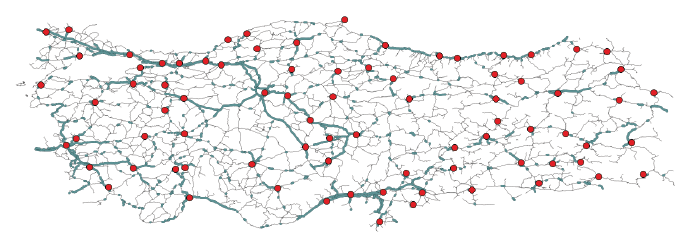
Panel A: 2005
Panel B: 2015
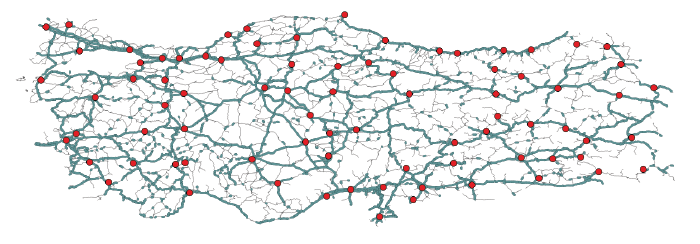
Source: Turkish General Directorate of Highways (GDH).
Note: Red nodes denote provincial centres, thin grey lines represent single-carriageway roads, and thick green lines represent dual-carriageway roads (highways and expressways).
Source: GDH and authors’ calculations.
Upgrades to the road network have greatly improved transport outcomes
While dual carriageways account for slightly more than a third of Turkey’s total road stock, they account for around 80 per cent of total traffic.13 Spending on road upgrades during the period 2003-10, when the bulk of the investment was undertaken, totalled US$ 12.7 billion (at 2010 prices) or 1.7 per cent of 2010 GDP. Road safety has greatly improved, with the number of fatalities per kilometre travelled declining by 62 per cent since 2003.
The increase in capacity has allowed vehicles to travel more reliably at higher speeds, reducing accident rates and making arrival times more predictable. The average travel time between pairs of cities has been reduced by 1.5 hours (see Chart 3.13) relative to the average of 6.5 hours in 2005 (see Box 3.2 for methodological details). Time savings increase the further apart cities are, reaching five hours in the case of cities that are 1,500 km or more apart.
Source: GDH and authors’ calculations.
Note: This chart plots declines in the fastest province-to-province travel times against distances as the crow flies. Each observation represents a pair of provinces.
Transport and domestic trade
What impact have these time savings had on trade within Turkey? This subsection assesses that impact using firm-to-firm transaction data provided by the Turkish Ministry of Industry, which are based on value added tax (VAT) declarations by Turkish firms. Bilateral trade flows between provinces have been constructed by aggregating data on sales and purchases by individual firms (see Box 3.2 for details). Information on the road network is taken from the official road maps published by the GDH for 2005 and 2015. The digitised maps of single and dual carriageways that are shown in Chart 3.11 have been used to calculate the fastest possible travel times between the 81 provincial centres using geographic information system (GIS) software (see Box 3.2 for details). Data on provincial employment come from the Ministry of Industry, while migration data and information on provincial income per capita come from the Turkish Statistical Institute.
Source: GDH, Turkish Ministry of Industry and authors’ calculations.
Note: Based on regression analysis as defined in equation (2) in Box 3.3. Estimates are reported for each quintile of the distribution of travel time saved.
Impact on income, employment and domestic migration
This subsection investigates the impact of the road improvement programme on provincial income, employment and domestic migration. First, this analysis looks at whether, within a geographical region, provinces that have experienced larger improvements in market access as a result of better roads have also posted stronger (nominal) income growth.15 Improvements in market access are measured by calculating an average of the reductions in travel times experienced by a province when selling goods/services to other provinces, weighted by the GDP of trading partners (see Box 3.3 for details). Improvements in market access tend, on average, to be associated with stronger income growth, although the effect is not statistically significant. Estimates obtained separately for each quintile of the distribution of improvements in market access do not show statistically significant effects either. This is consistent with earlier findings regarding provincial income growth in China.16
- 90% Confidence interval
- Estimate
Source: GDH, Turkish Statistical Institute and authors’ calculations.
Source: GDH, Turkish Statistical Institute and authors’ calculations.
Noticeable improvements for firms
This analysis concludes by looking at whether improvements in terms of increased trade and employment can also be observed at the level of individual Turkish firms and citizens. This is important, as in some instances economic dividends detectable in province-level data may accrue to just a handful of firms, without benefiting small and medium-sized businesses.
Source: World Bank and authors’ calculations.
Note: “UMC” denotes the average score for upper/middle-income countries on the basis of the World Bank’s classification.
Complementarity of infrastructure upgrades
Improvements to the flow of information as a result of investment in ICT can also lead to market integration, producing substantial economic benefits. As with the trade-related effects of road upgrades, more efficient diffusion of information on nearby markets can help to establish new links between consumers and firms.18 Enhanced competition can, in turn, lead to stronger firm dynamics, fostering growth in high-productivity firms, encouraging underperforming firms to exit the market and supporting overall productivity growth, both within and across industries (as discussed in Chapter 2).
Upgrades to different types of infrastructure – roads and telecommunications, for instance – may also be complementary in terms of their impact. Better information on nearby markets is more useful if these markets can be reached without incurring excessive costs. Similarly, better use will be made of upgrades to transport networks when buyers and sellers have access to information about distant markets. Reductions in travel and search costs can also promote financial inclusion, as discussed in Chapter 4 of the Transition Report 2016-17. Thus, the benefits of infrastructure upgrades can spill over into many different sectors.
Conclusion
Firms and households across the EBRD region tend to have good access to basic infrastructure. However, in many countries the quality of this infrastructure still leaves a lot to be desired. This is reflected in firms’ perception that inadequate infrastructure is having a detrimental impact on their day-to-day business. Improvements to the provision of electricity (primarily in the SEMED region), improvements in road capacity (across much of the EBRD region) and greater investment in ICT are all priorities in terms of upgrading existing infrastructure stock. Infrastructure investment totalling €1.9 trillion is required in the EBRD region over the next five years, which is the equivalent of spending 9 per cent of the region’s GDP each year. Specific infrastructure needs vary widely across countries. Some, for example, require large amounts of investment in order to bring infrastructure into line with the levels that would be expected on the basis of country-level characteristics such as GDP per capita or population density. Other economies require major investment in order to support future population and income growth and maintain their existing infrastructure networks.
Detailed analysis of the major coordinated road upgrades that have been carried out in Turkey since the early 2000s indicates that increases in market integration can have a significant impact on local economies. Improvements in market access have generated new trade links, allowing firms to obtain intermediate inputs from new sources, and produced benefits for consumers in terms of the variety of available products. Improvements in market access have also led to employment gains, which have, in turn, been associated with reductions in outward migration from previously isolated areas. These findings suggest that comprehensive infrastructure upgrades can be effective policy tools with the potential to improve the economic prospects of underperforming regions.
Over time, greater integration into domestic and international markets leads to changes in production processes and increases in productivity. Increased competition in markets can make firm dynamics healthier, as discussed in Chapter 2, leading to stronger productivity growth.
Specific infrastructure projects should be decided on within the context of each country’s economic environment and needs, taking account of any spillover effects for other sectors. The cost of expanding networks varies from sector to sector, as does the time required for construction, so the order and composition of upgrades could have an impact on the delivery of benefits in the short term. Coordinating investment across sectors and regions can be important in terms of optimising the impact of upgrades.
The scale of the infrastructure investment needs estimated in this chapter suggests that many countries will need to look beyond their domestic economies when it comes to financing such projects. Indeed, public resources are likely to fall a long way short of what is required in order to meet countries’ investment needs in the area of infrastructure. However, recent research points to a vast reservoir of private savings in search of longer-term investment opportunities.19 International financial institutions such as the EBRD can help to facilitate investment by private funds in several ways. They can, for example, provide region-specific expertise and help to mitigate risks stemming from asymmetric information, which can be extensive in infrastructure projects. Acting as lead investors in syndicated loans is one way to do this, increasing the attractiveness of such deals for certain private investors.20 They can also work with governments to improve the design and implementation capacity of public-private partnerships (see Annex 3.1 for details), as well as structuring deals involving project finance in order to better align incentives encouraging delivery on time and on budget (see Box 3.4 for details). Lastly, international financial institutions can help governments to design tender procedures for infrastructure projects with a view to reducing the likelihood of costly overruns and corruption, while at the same time delivering transparency and competitiveness.21
Box 3.1. Estimation methodology for infrastructure investment needs
Countries’ needs in terms of catch-up investment and support for future growth are estimated in two different ways. Both estimations pool countries in the EBRD region with advanced comparator countries from around the world. Each method estimates physical expansion needs in terms of catch-up investment and support for future growth for each infrastructure sector in each country. A unit cost of infrastructure expansion is then applied to all sector-specific estimates in order to express them in monetary terms and add them up.
The catch-up investment component is estimated using a random effects model for the period 1990-2015.22 This model takes account of countries’ GDP per capita at PPP, their rural and total populations, the percentages of GDP that are accounted for by agriculture and manufacturing, their land area and a measure of their geography (a “ruggedness index”).23 The catch-up component is the difference between a country’s predicted and actual values in terms of its infrastructure stock.
The future growth component is measured in a similar manner, but based on a fixed-effects model. This model takes account of all country-specific factors that do not change over time and might affect infrastructure, as well as factors that are common across all countries at a given point in time (year fixed effects). This model estimates the relationship between infrastructure levels and a country’s population and GDP.
Population forecasts and GDP projections are taken from the IMF’s World Economic Outlook for the period up to 2022. That projected GDP growth is cross-checked against the performance of each country’s synthetic comparator, as constructed in Chapter 1. A country’s desired growth rate is assumed to be that of its comparator or the country’s future growth as projected by the IMF, whichever is higher, plus one percentage point per year. The resulting GDP projections and population forecasts are then used to estimate the increases in the stock of infrastructure that will be needed between 2018 and 2022 in order to sustain that projected growth.
This estimation assumes that the experiences of advanced economies will be indicative of the infrastructure requirements of the EBRD region as it seeks to achieve higher income levels.24 It also makes simplified assumptions about unit costs and depreciation rates for infrastructure (see Table 3.1.1.), whereas these may in fact vary substantially across countries and over time. These estimates also ignore the fact that additional investment in infrastructure as part of the catching-up process may boost economic output, since reliable estimates of growth’s response to infrastructure are not readily available and are likely to be sector and country-specific.
<td1683
| Sector | Unit | Unit cost (US dollars) | Annual depreciation rate (per cent) |
|---|---|---|---|
| Broadband internet | Connection | 3.4 | 8 |
| Landline telephones | Connection | 261 | 8 |
| Mobile phones | Connection | 127 | 8 |
| Water supply | Connection | 161 | 3 |
| Sanitation facilities | Connection | 168 | 3 |
| Electricity capacity | Kilowatt | 2,513 | 2 |
| Road | Kilometre | 600,000 | 3 |
| Rail | Kilometre | 3,855,000 | 2 |
SOURCE: ADB.
NOTE: Unit costs are reported in 2010 prices. The euro/US dollar exchange rate is set at €0.78 per US dollar for all calculations.
Box 3.2. The data underlying the analysis of Turkish road upgrades
How are travel times and road speeds determined?
Average speeds are calculated for trucks using a representative sample of road segments on the basis of data from the GDH. While the maps in Chart 3.11 show both divided expressways and highways as dual carriageways, travel times assume a speed of 90 km/h on expressways and 110 km/h on highways. The speed on single carriageways is assumed to be 65 km/h. For each pair of provincial centres in Chart 3.13, ArcMap software is used to calculate the shortest possible travel time for both years on the basis of the above assumptions regarding speeds.
A new dataset on inter-firm linkages
Turkey’s Ministry of Industry provides firm-to-firm transaction data based on VAT declarations made to the Ministry of Finance by Turkish businesses. Since 2010, Turkish firms have been legally required to report, on a monthly basis, all purchases and sales exceeding TRY 5,000 (US$ 3,225) per buyer/seller, excluding VAT.
Sales and purchases are reported at firm level. However, this makes it difficult to identify the relevant location when firms have multiple plants. To help address this issue, the sample used in this estimation restricts the set of firms to (a) all single-plant firms, (b) all multi-plant firms with plants located in a single Turkish province and (c) multi-plant firms with plants located in multiple provinces, but at least 70 per cent of employment concentrated in a single province (which is then regarded as the firm’s location).
With 81 cities, there are 6,561 pairs of cities that can potentially trade with each other as buyers or sellers. The data on the amount of goods and services travelling from each source province to each destination province can be used to calculate trade flows in a given year. Since the data also cover transactions between firms within the same city, the source and the destination can be the same. The percentage of city pairs exhibiting zero trade fell from 43 per cent in 2006 to 12 per cent in 2015. The calculation of the long-term growth rate of bilateral domestic trade flows between 2006 and 2015 takes this large increase in the extensive margin into account. The mid-point growth formula defines change in trade between a source province (s) and a destination province (d) as

where ![]() and
and ![]() denote the value of trade between the source province and the destination province in 2015 and 2006 respectively.25 This measure is constrained between -2 and 2. In the data, the long-term growth rate of bilateral domestic trade is well defined for 5,781 pairs that report trade in at least one of the years in question. Only 145 of these exhibit a decline in trade. For all other pairs, the growth rate (
denote the value of trade between the source province and the destination province in 2015 and 2006 respectively.25 This measure is constrained between -2 and 2. In the data, the long-term growth rate of bilateral domestic trade is well defined for 5,781 pairs that report trade in at least one of the years in question. Only 145 of these exhibit a decline in trade. For all other pairs, the growth rate (![]() ) is strictly positive.
) is strictly positive.
Box 3.3. Technical details relating to the analysis of Turkish road upgrades
Bilateral trade and travel times
The initial analysis estimates a gravity-type model using first-differences regression. In this regression, the dependent variable is the growth rate of bilateral domestic trade flows between Turkish provinces in the period 2006-15. The savings in terms of travel times between pairs of provinces are the independent variable. First-differences estimation eliminates all time-invariant characteristics of the source province, the destination province and their pairs that affect bilateral trade flows (such as the distance between provinces). This estimation also takes account of province-level characteristics that affect changes in trade in each province (with ![]() and
and ![]() representing source and destination fixed effects respectively):
representing source and destination fixed effects respectively):

Standard errors are clustered at the source and destination levels (two-way clustering).
To test for non-linear effects, the continuous variable for time savings in equation (2) is replaced by indicator variables for each quintile of its distribution. Estimates are obtained in respect of trade flows within provinces (the omitted category).
To examine the effect on new trade links, a similar relationship is estimated for the probability of observing positive trade for a pair of provinces in 2015, provided that the pair had zero trade in 2006 (see column 2 of Table 3.3.1 for the results).
Looking deeper: income growth, employment and migration
This element of the analysis looks at whether provinces that experienced greater improvements in market access as a result of upgrades to roads also recorded stronger income or employment growth or experienced different domestic migration patterns. Improvements in market access are measured by calculating a weighted average of the reductions in travel times experienced by a province when selling goods to other provinces. Each province’s time savings are weighted on the basis of destination provinces’ GDP figures for 2005 as follows:

The following equation is estimated for each outcome variable (such as income growth):

where ![]() denotes region fixed effects. Non-linear effects can be examined via a set of quintile indicator variables for the distribution of weighted time savings, as above. Data on provincial labour force participation are only available for the period 2008-13, and this analysis fails to find any impact on labour force participation as a result of changes in market access. As data on bilateral migration flows are not available, this analysis uses data on changes in population flows in and out of each individual province. The results are reported in Table 3.3.1.
denotes region fixed effects. Non-linear effects can be examined via a set of quintile indicator variables for the distribution of weighted time savings, as above. Data on provincial labour force participation are only available for the period 2008-13, and this analysis fails to find any impact on labour force participation as a result of changes in market access. As data on bilateral migration flows are not available, this analysis uses data on changes in population flows in and out of each individual province. The results are reported in Table 3.3.1.
| Dependent variable | Change in bilateral trade flows, 2005-15 | New trade links in 2015 | Change in GDP per capita | Change in employment | Change in immigration | Change in emigration |
|---|---|---|---|---|---|---|
| [1] | [2] | [3] | [4] | [5] | [6] | |
| Time savings (hours) | 0.061*** | 0.072*** | ||||
| (0.011) | (0.010) | |||||
| Time savings weighted by GDP | 0.001 | 0.006* | 0.001 | -0.003* | ||
| (0.001) | (0.003) | (0.002) | (0.002) | |||
| Fixed effects | Source and destination | Source and destination | Region | Region | Region | Region |
| No. of observations | 5,781 | 6,561 | 81 | 81 | 81 | 81 |
| R2 | 0.217 | 0.222 | 0.160 | 0.461 | 0.089 | 0.190 |
SOURCE: GDH, Turkish Ministry of Industry, Turkish Statistical Institute and authors’ calculations.
NOTE: All regressions are estimated using ordinary least squares. Robust standard errors with two-way clustering at the level of source and destination provinces are indicated in parentheses. *, ** and *** denote values that are statistically significant at the 10, 5 and 1 per cent levels respectively.
Box 3.4. Project finance in the EBRD context
Infrastructure projects typically require large amounts of investment up front, long before any revenues materialise. They also tend to involve uncertainty regarding future demand. This means that firms implementing infrastructure projects are exposed to significant amounts of risk. A common way of mitigating such risk is the use of special-purpose vehicles (SPVs).
SPVs are set up for the sole purpose of carrying out a specific project. In order to ring-fence project-related risk, they are legally independent of the entity that created them. SPVs vary in terms of their legal structure, ownership, management and financing. While these arrangements can be analysed through the lens of a large body of literature on finance and contract theory, there is little empirical evidence indicating which arrangements work best in which circumstances.
Case study: Pestera Wind
The Pestera Wind project serves as an interesting case study with regard to project structure. This project was agreed in 2010 in order to finance the construction of two wind farms in Romania, with a total generating capacity of more than 230 MW. Ownership of the SPV was split between a firm from Portugal (85 per cent) and a firm from Cyprus (15 per cent). Thus, it was highly concentrated, with no government involvement. Construction finished slightly ahead of schedule and cost less than expected. The project achieved a high score for transition impact as measured by the EBRD, reflecting its contribution in terms of demonstrating a successful SPV arrangement and strengthening competition in the market.
Source: EBRD and authors’ calculations.
This analysis suggests that special measures encouraging closer monitoring may be helpful where ownership of SPVs is less concentrated. More dispersed ownership need not necessarily undermine a project’s success. Indeed, in some cases less concentrated ownership may help to manage risk and raise the necessary funds. Closer monitoring could be encouraged, for instance, by rewarding the parties responsible for monitoring when cost overruns are successfully avoided.
References
A. Abiad, M. Debuque-Gonzales and A. Sy (2017)
“The Evolution and Impact of Infrastructure in Middle-Income Countries: Anything Special?”, ADB working paper, forthcoming.
ADB (2017a)
Meeting Asia’s Infrastructure Needs.
ADB (2017b)
“Transcending the Middle-Income Challenge”, Asian Development Outlook 2017, Part 2.
J. Aker (2010)
“Information from markets near and far: Mobile phones and agricultural markets in Niger”, American Economic Journal: Applied Economics, Vol. 2, pp. 46-59.
T. Allen and C. Arkolakis (2014)
“Trade and the Topography of the Spatial Economy”, The Quarterly Journal of Economics, Vol. 129, pp. 1085-1140.
R. Arezki, P. Bolton, S. Peters, F. Samama and J. Stiglitz (2017)
“From Global Savings Glut to Financing Infrastructure”, Economic Policy, Vol. 32, Issue 90, pp. 221-261.
A. Banerjee, E. Duflo and N. Qian (2012)
“On the Road: Access to Transportation Infrastructure and Economic Growth in China”, NBER Working Paper No. 17897.
N. Branzoli and F. Decarolis (2015)
“Entry and subcontracting in public procurement auctions”, Management Science, Vol. 61, pp. 2945-2962.
P. Carter, F. Decarolis and N. Young (2017)
“Subsidising the private sector for development: lessons from mechanism design”, IED Working Paper No. 295, Boston University.
A.K. Coşar and B. Demir (2016)
“Domestic road infrastructure and international trade: Evidence from Turkey”, Journal of Development Economics, Vol. 118, pp. 232-244.
A.K. Coşar, B. Demir and N. Young (2017)
“Road capacity, domestic trade and regional outcomes”, EBRD working paper, forthcoming.
S. Davis, J. Haltiwanger and S. Schuh (1996)
“Small Business and Job Creation: Dissecting the Myth and Reassessing the Fact”, Small Business Economics, Vol. 8, pp. 297-315.
T. Dinkelman (2011)
“The Effects of Rural Electrification on Employment: New Evidence from South Africa”, American Economic Review, Vol. 101, pp. 3078-3108.
G. Duranton, P. Morrow and M. Turner (2014)
“Roads and Trade: Evidence from the US”, The Review of Economic Studies, Vol. 81, pp. 681-724.
European Commission (2014)
The European Union explained: Regional policy (doi:10.2775/74781).
B. Faber (2014)
“Trade integration, market size, and industrialization: evidence from China’s National Trunk Highway System”, The Review of Economic Studies, Vol. 81, pp. 1046-1070.
M. Fay and T. Yepes (2003)
“Investing in Infrastructure: What is Needed from 2000 to 2010?”, World Bank Policy Research Working Paper No. 3102.
GDH (2014)
Divided Highway Project website: www.kgm.gov.tr/Sayfalar/KGM/SiteTr/Projeler/Projeler-BolunmusYol.aspx
R. Jensen (2007)
“The digital provide: Information (technology), market performance, and welfare in the South Indian fisheries sector”, The Quarterly Journal of Economics, Vol. 122, pp. 879-924.
R. Jensen and N. Miller (2017)
“Information, demand and the growth of firms: Evidence from a natural experiment in India”, working paper.
N. Limao and A. Venables (2001)
“Infrastructure, geographical disadvantage, transport costs, and trade”, The World Bank Economic Review, Vol. 15, pp. 451-479.
McKinsey Global Institute (2013)
Infrastructure productivity: How to save $1 trillion a year.
M. Melitz and D. Trefler (2012)
“Gains from trade when firms matter”, Journal of Economic Perspectives, American Economic Association, Vol. 26, pp. 91-118.
N. Nunn and D. Puga (2012)
“Ruggedness: The Blessing of Bad Geography in Africa”, The Review of Economics and Statistics, Vol. 94, pp. 20-36.
Annex 3.1. Legal frameworks governing public-private partnerships: insights and recommendations
Introduction
Efficient and transparent policies are vital for the effective functioning of the infrastructure sector (which includes, for example, energy, transport and water supply, as well as social infrastructure for education and health care), as are legal and institutional frameworks that encourage private-sector participation. Over the past 12 years, the EBRD has conducted a number of assessments looking at the effectiveness of legislative frameworks governing public-private partnerships (PPPs) in the EBRD region.
Methodology
The two-part assessments are based on a set of criteria developed by the EBRD. Part I looks at the comprehensiveness of legal rules, while Part II deals with issues of policy, institutional framework and lessons learned from the implementation of PPP projects.
In the 2017 assessment, which was carried out on the basis of laws and regulations as at 30 June 2017,4 the countries in the EBRD region were divided into two groups. The first group was assessed using a range of public resources (legislation, national reports, legal articles, research findings and press coverage). The second group, which consisted of 12 countries,5 was subjected to a more extensive assessment, which included interviews with national authorities and private-sector stakeholders. The assessment’s findings were then verified by qualified local lawyers, with each country being given a score.
| Part I – Legislative Framework Assessment (LFA) |
|---|
| 1. Legal framework governing PPPs |
| 2. Preparation of projects |
| 3. Selection of private partners |
| 4. Project agreements |
| 5. Security and support issues |
| Part II – Legal Indicators Survey (LIS) looking at effectiveness |
| 6. Policy framework |
| 7. Institutional framework |
| 8. Award statistics |
| 9. Business environment for PPPs |
Source: EBRD (2017).
In 2017, Part I of the assessment was expanded to cover the following: threshold amounts, the involvement of state-owned companies on the private side, changes to shareholdings in project companies, the use of a public-sector comparator or a value-for-money test, competitive dialogue, monitoring procedures and direct agreements. There was also a greater focus on preparatory work and project selection in the form of compulsory feasibility studies, as well as additional questions on unsolicited proposals.
Part II, meanwhile, was expanded to cover two new core areas: award statistics and the business environment for PPPs. These included statistical and other questions aimed at providing a better understanding of how PPPs work in general and the level of development of the PPP industry in each country (which will itself help to determine how quickly any new PPP law is successful).
In addition to the above assessment criteria, a few other new criteria were also included in the 2017 assessment. These included a “bankability test” and “red flags”. The bankability test seeks to establish whether a country’s legal framework incorporates the fundamental requirements for making PPPs feasible for financing as seen from a lender’s perspective, while red flags indicate a lack of basic minimum compliance requirements, which is a deal-breaker for most investors.
The countries were placed in five groups on the basis of the EBRD’s assessment of their compliance with international standards and the effectiveness of their legal frameworks.
| ≥ 90% | Very high level of compliance/effectiveness |
| 70-89% | High level of compliance/effectiveness |
| 50-69% | Moderate level of compliance/effectiveness |
| 30-49% | Low level of compliance/effectiveness |
| < 30% | Very low level of compliance/effectiveness |
Source: EBRD (2017).
Findings on compliance
Very highly compliant countries
Mongolia, which displayed a very high level of compliance in the 2011 assessment, has maintained that ranking. Its Concessions Act, which was adopted in 2010, represents a comprehensive legal framework governing both concessions and PFI-type PPPs. The Concessions Act provides for a broad range of models, as well as a number of different security instruments. It also allows for the option of government support and guarantees. Meanwhile, bankability is supported by the option of direct agreements and step-in rights.6
Serbia, meanwhile, has significantly improved its ranking since the 2011 assessment. Its PPP and Concession Law was amended in December 2016, with the result that Serbia now boasts a comprehensive and very highly compliant legal framework governing PPP projects.
Highly compliant countries
A large number of countries have been placed in the second-highest category on account of their sophisticated legal frameworks, their transparent procurement practices, their easy access to justice (including arbitration), and the fact that a range of security instruments are available, all of which facilitate financing.
Source: EBRD (2017). Note: Although it had not yet been adopted at the time of the assessment, so was not taken into consideration, Georgia’s new PPP Law, which is due to be finalised and adopted shortly, should significantly improve its PPP framework and make it more compliant with internationally accepted standards and best practices.
Moderately compliant countries
Moderately compliant countries are characterised by a business-friendly environment and fairly well developed legal frameworks, which provide for opportunities to establish PPP projects. Core aspects, such as (i) the legal framework and (ii) guidelines or flexibility as regards the contents of a project agreement, the selection of a private partner and the availability of reliable security instruments, are covered by laws and regulations, although not always in a comprehensive and clear manner. This can cause scepticism and increase the risks perceived by investors.
Low-compliance countries
Low-compliance countries continue to face challenges in the core assessment areas. These countries typically recognise PPPs, but have so far failed to establish an appropriate legal framework.
Problems often relate to an absence of clarity regarding the scope of a country’s framework, non-transparent tender procedures, a lack of flexibility as regards the contents of project agreements and the absence of reliable security instruments (such as step-in rights or the possibility of government support or guarantees). Immature securities markets also have a tendency to hinder investment.
Findings on effectiveness
The effective implementation of laws is a challenge in many countries. Where countries do not have dedicated legislative frameworks specific to concessions or PFI-type PPPs, or they have low-compliance frameworks, the reasons for such a lack of effectiveness are fairly clear. Investors expect legal certainty regarding the scope of a law’s application and may be discouraged if a PPP project is only governed by general laws, such as the country’s civil code or an investment law. General laws do not typically provide for mechanisms which ensure bankability, such as feasibility studies, fair compensation in the event of termination, step-in rights, or the option of direct agreements between lenders and the contracting authority to give lenders the opportunity to rectify debtors’ failings under project agreements.
Source: EBRD (2017). Note: Although it had not yet been adopted at the time of the assessment, so was not taken into consideration, Georgia’s new PPP Law, which is due to be finalised and adopted shortly, should significantly improve its PPP framework and make it more compliant with internationally accepted standards and best practices.
What can policy-makers do?
Establish a firm policy that will be adhered to irrespective of political developments
A comprehensive policy document and/or clear strategic guidelines will indicate a country’s commitment to using PPPs in order to achieve national development goals. Policy documents are particularly welcome in low-compliance countries, but some high-compliance countries also need to make more effort in this area in order to ensure that their policy documents are successfully implemented.
Azerbaijan, Jordan, Russia and Uzbekistan would all benefit from having a strategy document, which would signal their readiness to develop and implement PPP projects. Positive examples in FYR Macedonia, Kosovo, Mongolia, Montenegro and Turkey prove that adherence to a policy document significantly raises the PPP readiness index. Moreover, frequent changes of government may also impede the implementation of policy.
Extol the benefits of PPPs in public
PPP projects need additional promotion, especially in countries with small numbers of transactions, preferably by means of awareness-raising campaigns run at national level.
The public often have limited knowledge about the benefits and advantages of PPPs, which may lead to resistance. PPPs are often regarded as expensive models that favour private partners and facilitate the privatisation of public wealth and services via the back door. This is especially true if PPPs have previously been associated with corruption or negative experiences in the form of failed projects, bad management or a lack of feasibility studies.
The need for an awareness-raising campaign is particularly high in Croatia, Egypt, Jordan and Lithuania, which have high-compliance frameworks but do not make sufficient use of them, partly owing to limited public support for PPPs.
Develop a set of template documents
Even in the presence of well-established legal frameworks, many countries need assistance in order to expedite PPP projects, given their complexity. Template documents (such as tender forms or standard contracts) drawn up by a government PPP unit can provide useful guidance to public entities when it comes to the development and negotiation of PPPs, especially if those template documents incorporate the standards expected by investors.
Such template documents need to be flexible (that is to say, they should be for guidance only), as binding standard contracts are likely to lead to red flags. All countries except Mongolia need to develop template documents, although some countries (particularly Croatia) have been using EU structural funds to develop templates in particular sectors.
Enhance the institutional framework
Countries with well-developed legal frameworks usually have a dedicated unit or body dealing specifically with PPPs. These bodies are established by law and have predefined competences that guarantee their involvement in the selection, oversight and implementation of projects.
Enhance the legal framework
A dedicated legal instrument governing PPPs
In the past, it was common for non-concession PPPs (and even some concessions) to be awarded under general laws (for example, investment laws, civil codes or public procurement laws), but countries now tend to have a dedicated legal instrument governing such arrangements.
Variety/flexibility in terms of models
Some countries adopt a PPP law in addition to a concession law, while others opt for a single piece of legislation covering both concessions and other PPPs. Many countries recognise the need to provide for a wide range of PPP arrangements (including BOT models). Examples of countries providing for a variety of BOT models/concessions and non-concession PFI-type PPPs include Croatia, FYR Macedonia (where only the BOO model is not permitted), Kosovo, Lithuania and Mongolia.
Feasibility studies
An economic feasibility study ascertaining the viability and financial sustainability of a project over the lifetime of the contract (as well as the project’s socio-economic benefits and environmental impact) is an essential element of the preparatory process. Many countries (including Albania, Bosnia and Herzegovina, Bulgaria, FYR Macedonia, Jordan, Kosovo, Montenegro, Serbia and Turkey) have recognised the importance of feasibility studies. Albania, for example, has detailed PPP legislation in this regard and requires contracting authorities to thoroughly evaluate PPP projects in the preparatory phase. However, the effectiveness of such legislation in practice remains to be seen and may depend on further guidance, capacity-enhancement measures and other factors.
Selection of private partners
Private partners must be chosen by means of a fair and transparent selection process. Exemptions allowing for direct negotiations should be limited, and legislation should contain clear rules on the choice of tender procedure.
Establish a “one-stop shop” for permits
Policy-makers often focus solely on the award procedure itself. However, private entities face many other legal issues when it comes to PPPs, particularly as regards the permits required for construction and operations.
Such problems can be addressed by means of a “one-stop shop” incorporating other permits that need to be obtained in connection with the PPP contract. From the perspective of a private partner (especially a foreign investor), the fact that permits are granted by different authorities (potentially at different administrative levels) or authorities have conflicting competences can represent a major obstacle. Having a single authority to deal with as many permits as possible by means of a single procedure will allow national and international investors to save both time and money. Despite the great practical significance of such issues, only a few countries have applied this concept thus far. Indeed, even very highly compliant countries such as Serbia have not yet implemented this concept.
Provide for reliable security instruments
The bankability of a project is dependent on the availability of reliable security instruments relating to the rights and assets of the private partner in the project and other instruments that can be used to contractually secure the private partner’s cash flow in favour of lenders. In order to stabilise a private partner or a project company in turbulent economic times, direct agreements and step-in rights are required. The option of government support and guarantees regarding the contracting authority’s proper fulfilment of its obligations will also significantly reduce risks relating to the financing of projects.
Provide for international arbitration and enforcement of arbitral awards
Privately financed infrastructure projects require reliable dispute resolution mechanisms that are trusted by investors. International arbitration is a key dispute resolution instrument, and the absence of a provision enabling international arbitration is sometimes regarded by investors as a deal-breaker or an indication of significant political risk.
Conclusion
A significant number of countries have amended their legislation since the 2011 assessment, either building on laws adopted prior to 2011 or introducing laws governing non-concession PPPs in addition to existing legislation on concessions.
Highly and very highly compliant countries have the potential to establish significant numbers of PPPs in the next 10 years. However, their current transaction record seems to point to the under-utilisation of such legislation, partly reflecting a perceived lack of political desire to promote the use of PPPs, as well as the need to train public officials.
Moderately compliant countries have supportive business environments and fairly well-developed legal frameworks, providing opportunities for the establishment of PPP projects. However, core areas relating to project selection, tender procedures and the bankability of projects need to be improved further in order to increase transparency and legal certainty.
Lastly, countries with low and very low levels of compliance need to adopt dedicated legislation governing PPPs or improve their legal frameworks in other ways.
All countries should continue to enhance their institutional capacities, preferably by establishing a specialist unit tasked with developing, actively promoting and supervising state-of-the-art PPP solutions.
References
EBRD (2012)
Concession/PPP laws assessment 2011.
EBRD (2017)
Concession/PPP laws assessment 2017, forthcoming.
Subscribe to the EBRD Transition Report 2017-18 mailing list.
Sign up to receive important announcements and emails about the Transition Report.