Introduction
Last year the EBRD conducted a review of its transition concept. That review built on the findings of the Transition Report 2013 (“Stuck in Transition?”), which analysed structural reforms in the EBRD’s countries of operations and was a catalyst for reflections on the modern-day relevance of the transition framework adopted in the 1990s. That review took account of all the economic developments that had been observed over the previous 25 years, as well as the EBRD’s wealth of experience in supporting countries’ transition from planned to market economies.
This has resulted in an updated interpretation of transition, under which a sustainable market economy is characterised by six key qualities; the economy should be competitive, well governed, green, inclusive, resilient and integrated. With the agreement of its shareholders, the EBRD now looks at transition countries’ development and the impact of its operations through the prism of those six qualities.
This section takes a closer look at what those qualities mean and how they can be translated into new measures of progress that also contribute to shaping the global narrative on development. An outline of the EBRD’s new assessment methodology is followed by a summary of key results.
This section also provides an overview of structural reforms in the region over the past year. This year, those developments are described using a new set of scores that cannot be directly compared with earlier sectoral scores. As of next year, progress in the area of structural reform will be assessed on the basis of upward or downward changes to these new scores.
The six qualities of a sustainable market economy
In the early 1990s, transition countries faced a common set of challenges, ranging from reforming economic systems and introducing market-based prices to creating appropriate institutional frameworks for growth and economic stability. Policy-makers encountered many major economic and social problems: industrial output, real wages and salaries fell, while inflation and unemployment both rose rapidly; and trade declined with the collapse of the main reference market (COMECON), while penetrating new markets on the basis of existing technology proved difficult. Since then, transition economies have experienced significant changes in terms of their institutions and markets, and those changes have varied considerably in terms of their pace and magnitude. Initially, with the market economy a distant goal, the direction of change was broadly uniform. However, as countries have progressed along the transition path, they have faced different conditions and drivers of development. As a result, the economies of the EBRD region are now far more diverse in terms of their institutional development and market orientation.
Transition indicators
Since the mid-1990s, the EBRD has sought to quantify countries’ progress towards market economies with the aid of a set of transition indicators. This year, that assessment methodology has been updated in order to reflect the revised transition concept. The new methodology is based on the six qualities of a sustainable market economy, rather than structural or sectoral indicators (see Box S.1 for an overview of past approaches to the measurement of transition).
New transition indicators: coverage and methodology
The first stage of this assessment process involves the identification of relevant key components for each quality (see Table S.1).
The assessment of competitiveness looks at market structures that support competition and incentives for sound decision-making (including measures of openness, business skills and the business environment). It also takes account of firms’ capacity to add value and innovate (including measures of access to appropriate infrastructure and resources).
The assessment of the extent to which an economy is well governed builds on the EBRD’s existing analysis of corporate governance for private enterprises, which is complemented by a measure of integrity. In addition, that analysis also incorporates measures of the quality of public governance, the control of corruption and the rule of law, which are based on available external sources.
| Quality | Components |
|---|---|
| Competitive | Market structures for competition and business standards |
| Capacity to add value and innovate | |
| Well-governed | National-level governance |
| Corporate-level governance | |
| Green | Mitigation of climate change |
| Adaptation to climate change | |
| Other environmental areas | |
| Inclusive | Gender equality |
| Regional disparities | |
| Opportunities for young people | |
| Resilient | Financial stability |
| Resilient energy sector | |
| Integrated | Openness to foreign trade, investment and finance |
| Domestic and cross-border infrastructure |
SOURCE: EBRD.
Source: EBRD.
New transition indicators: results
The scores and rankings of individual countries vary across qualities. For example, Slovenia is ranked fifth to seventh in terms of being well governed, resilient and integrated, but second or third in terms of being competitive, green and inclusive. These results may reflect variation in countries’ priorities.
Regional aggregates (see Chart S.2) show that countries in the EBRD region tend, on average, to be furthest away from the frontier in the areas of competitiveness and good governance. At the same time, the EBRD region appears to be relatively well integrated, with much of that being driven by external integration.
| Competitive | Well-governed | Green | Inclusive | Resilient | Integrated | |
|---|---|---|---|---|---|---|
| Central Europe and the Baltic states | ||||||
| Croatia | 5.75 | 5.14 | 6.03 | 6.03 | 6.61 | 6.85 |
| Estonia | 7.58 | 7.58 | 6.44 | 7.30 | 8.19 | 7.77 |
| Hungary | 6.42 | 5.31 | 6.37 | 6.27 | 6.65 | 7.89 |
| Latvia | 6.53 | 6.09 | 6.37 | 6.82 | 7.66 | 7.73 |
| Lithuania | 6.06 | 6.10 | 6.06 | 7.05 | 7.23 | 7.78 |
| Poland | 6.38 | 6.15 | 6.56 | 6.29 | 7.64 | 6.79 |
| Slovak Rep. | 6.82 | 4.98 | 7.05 | 5.73 | 7.64 | 7.85 |
| Slovenia | 6.93 | 5.74 | 6.67 | 7.02 | 7.44 | 7.61 |
| South-eastern Europe | ||||||
| Albania | 4.41 | 4.31 | 4.85 | 5.11 | 4.86 | 5.76 |
| Bosnia and Herz. | 4.74 | 3.66 | 4.85 | 4.83 | 5.35 | 5.47 |
| Bulgaria | 5.96 | 4.69 | 5.82 | 5.33 | 6.54 | 6.86 |
| Cyprus | 7.21 | 6.15 | 5.76 | 6.20 | 5.19 | 6.52 |
| FYR Macedonia | 5.39 | 5.20 | 4.91 | 4.72 | 5.31 | 6.04 |
| Greece | 6.31 | 4.34 | 6.27 | 5.63 | 6.67 | 6.38 |
| Kosovo | 3.37 | 3.73 | 3.80 | 4.70 | 5.09 | 4.89 |
| Montenegro | 4.89 | 5.12 | 5.15 | 5.62 | 5.93 | 5.59 |
| Romania | 6.28 | 4.97 | 5.86 | 5.08 | 6.98 | 6.88 |
| Serbia | 4.94 | 4.39 | 5.77 | 5.16 | 5.55 | 6.39 |
| Turkey | 4.89 | 5.30 | 5.12 | 4.21 | 7.08 | 5.90 |
| Eastern Europe and the Caucasus | ||||||
| Armenia | 4.47 | 4.79 | 5.41 | 5.72 | 5.04 | 5.94 |
| Azerbaijan | 3.64 | 4.61 | 5.23 | 4.71 | 4.46 | 5.84 |
| Belarus | 4.99 | 4.32 | 6.16 | 5.72 | 4.17 | 5.38 |
| Georgia | 4.54 | 5.98 | 4.58 | 5.14 | 5.71 | 6.54 |
| Moldova | 4.87 | 3.94 | 4.14 | 5.19 | 5.27 | 5.64 |
| Ukraine | 4.68 | 3.58 | 5.54 | 5.88 | 4.60 | 5.04 |
| Russia | 5.20 | 4.55 | 4.92 | 5.94 | 5.95 | 5.17 |
| Central Asia | ||||||
| Kazakhstan | 4.30 | 5.05 | 4.42 | 5.37 | 5.66 | 5.00 |
| Kyrgyz Rep. | 3.45 | 3.33 | 4.36 | 4.46 | 4.98 | 4.94 |
| Mongolia | 4.25 | 4.50 | 5.28 | 5.64 | 4.57 | 5.68 |
| Tajikistan | 2.66 | 3.69 | 5.58 | 4.58 | 3.76 | 4.23 |
| Turkmenistan | 1.46 | 3.83 | 4.13 | 4.86 | 3.12 | 4.64 |
| Uzbekistan | 2.72 | 4.32 | 3.20 | 5.34 | 3.98 | 4.20 |
| Southern and eastern Mediterranean | ||||||
| Egypt | 2.87 | 3.90 | 4.41 | 4.24 | 5.41 | 4.27 |
| Jordan | 3.92 | 5.26 | 5.65 | 4.88 | 5.66 | 6.12 |
| Lebanon | 4.92 | TBD | TBD | TBD | TBD | 5.82 |
| Morocco | 3.98 | 4.35 | 5.47 | 4.16 | 6.06 | 5.45 |
| Tunisia | 3.94 | 4.33 | 4.78 | 4.72 | 4.75 | 4.70 |
SOURCE: EBRD.
NOTE: Scores range from 1 to 10, where 10 denotes the synthetic frontier for each quality. The inclusion score for Uzbekistan covers gender equality and regional disparities only. The inclusion score for Turkmenistan covers gender equality only. “TBD” indicates scores that are not yet available.
Source: EBRD and authors’ calculations.
Note: “Advanced comparators” denotes the average score for Germany, Sweden and the United States of America. The average for SEMED does not include Lebanon.
Overview of reforms over the past year
The new transition methodology outlined above provides a useful framework for thinking about reforms and evaluating reform efforts against the needs and gaps identified in the new scoring system. The past year has seen a range of reforms being implemented across the region, as well as a number of reversals, and these developments can be viewed through the prism of the new transition concept – despite the fact that, with the new system having only just been introduced, countries’ transition scores are not directly comparable with data for previous years. The country pages of the online version of this report contain detailed evaluations of all the main structural reforms in each country over the last year, but the key developments are reported below.
Competitive
This quality covers a broad range of reforms aimed at making it easier for firms to do business and grow, improving the attractiveness of the economy for investors, and enhancing skills and innovation. Not surprisingly, a number of countries have made changes with the aim of improving the competitiveness of individual companies or entire sectors over the last year. Many such reforms have been seen in the CEB region, for instance, as well as Central Asia.
Well-governed
Improving governance is a difficult task and typically requires a sustained commitment to reforms over a period of time. Several SEMED countries have recently embarked on major reforms of their public administrations and civil services. In Tunisia, for example, the government adopted a new strategy earlier this year with the aim of reforming its civil service. That strategy aims to streamline the civil service by 2020 and substantially reduce its wage bill. Morocco has also made progress with reforms to its civil service, while the Jordanian government has carried out a comprehensive public investment management assessment with a view to enhancing the efficiency of public investment spending.
Green
Major progress has been seen right across the region in the area of green transition, especially as regards the development of renewable energy.
The Egyptian government’s Sustainable Energy Strategy, which was approved in 2016 and covers the period up to 2035, has formalised its commitment to renewable energy. That strategy seeks to establish a sustainable and diverse energy mix and reconfirms the ambitious target (previously set in 2008) of obtaining 20 per cent of electricity from renewable sources (particularly solar and wind) by 2022. Achieving this target will require massive investment, most of which is expected to come from the private sector.
Inclusive
The issue of inclusion poses major challenges across large parts of the EBRD region. The large skills gaps and high levels of youth inactivity in the SEMED region and the Western Balkans are hindering young people’s access to skills and employment. Meanwhile, legal and regulatory barriers are continuing to prevent women from participating in labour markets to the same extent as men, particularly in the SEMED region, Turkey and Central Asia. In addition, variation in the quality of local institutions and access to services within individual countries is exacerbating regional inequality and limiting convergence in the SEE region and Central Asia. Moreover, for many countries, the ongoing refugee crisis and increased migration flows are posing substantial challenges. Nevertheless, efforts to promote inclusive growth are under way across the region.
Resilient
A number of countries have taken important steps to strengthen the resilience of their financial sectors in the last year. Indeed, there have been a large number of developments relating to this quality, suggesting that countries are still making major efforts to reform and strengthen their financial systems. In addition, some countries have taken steps towards putting their energy sectors on a more financially sustainable footing.
Integrated
Most of the countries in the EBRD region can be regarded as small, open economies, but barriers to cross-border integration persist. These barriers are gradually being broken down, with important advances being observed in the SEE region and Central Asia over the last year. Regional integration has been an important objective for SEE countries in recent years, but the poor quality of infrastructure has often been an obstacle to cross-border trade and investment. Albania, FYR Macedonia, Kosovo and Montenegro have all made major progress in the area of road building in the past year. However, important road projects in Bosnia and Herzegovina are being delayed by the authorities’ failure to amend the law on fuel excise duties and allow an increase in the price of fuel.
Box S.1. Measuring transition: an overview of past approaches
The EBRD has been assessing the progress made by countries of operations and attempting to quantify it since 1994. Transition scores are constructed on the basis of the EBRD’s experience, surveys and available data, reflecting both the magnitude of countries’ achievements and the scale of the remaining challenges. The first set of transition indicators was introduced in 1994 and covered various aspects of the transition process, focusing on what were considered to be the core elements of the market economy: enterprises and households, markets and financial institutions. The indicators that were selected on the basis of that conceptual framework ranged from privatisation and enterprise restructuring to price liberalisation and banking reform. That first generation of transition indicators was expanded over the years, being supplemented by measures relating to the development of the financial sector and infrastructure.
Box S.2. Scoring methodology
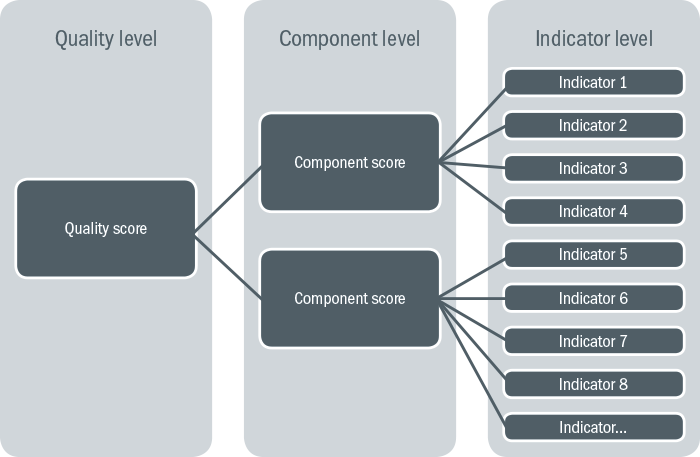
The raw data for each indicator are normalised to the same scale (0 to 1) using the values for the best and worst performers. If the highest value equates to the best performance, that transformation is carried out as follows:

This ensures the comparability of scores across indicators. The next step is to aggregate those normalised data at component level using simple averaging. Lastly, components are averaged in order to obtain quality-level indicators using specific weights. Those weights are based primarily on the EBRD’s judgement as to their relative importance (see the methodological notes in the online version for details). The resulting scores are then rescaled from 1 to 10, where 10 represents the frontier for each quality.
Methodological notes
Transition indicators: six qualities of a sustainable market economy
The transition indicators reflect the judgement of the EBRD’s Office of the Chief Economist and the Economics, Policy and Governance department on progress in transition by quality. The scores range from 1 to 10 and are based on an assessment of the size of the challenges in the components of each quality. The scoring for the components is based on either publicly available data or observable characteristics and outcomes.
The following tables show, for each quality, the components used in each case, and the indicators and data sources that fed into the final assessments. The majority of the indicators are quantitative, with some qualitative indicators being used where necessary. Indicators have been constructed using a wide range of sources, including national and industry statistics, data from other international organisations (such as the World Bank, the International Monetary Fund and the United Nations) and surveys such as the EBRD Business Environment and Enterprise Performance Survey (BEEPS) and the Life in Transition Survey (LiTS), as well as expert qualitative assessments.
| Quality | Components | Sub-components | Indicators | Source |
|---|---|---|---|---|
| Competitive | Market structure that supports competition and incentives for sound decision-making [53%] | Openness | Most favoured nation (MFN) applied tariff rates (weighted) | World Bank Development Indicators (WDI), 2015 |
| Dynamic structures | Entry of new firms (composite) | World Bank Development Indicators (WDI), 2014, World Bank Doing Business, 2015 | ||
| Resolving insolvency score | World Bank Doing Business, 2015 | |||
| SME sector development | EBRD assessment, latest available | |||
| Institutions | Doing Business overall score | World Bank Doing Business, 2015 | ||
| Subsidies provided to private sector | International Monetary Fund, GFS 2015 | |||
| Business skills | ISO 9001 certification (per population) | ISO, 2015 | ||
| Share of business services in services exports | World Bank Development Indicators (WDI), 2015 | |||
| Capacity to add value and innovate [47%] | Value chains | Economic complexity index | Harvard CID, 2014 | |
| Labour productivity | Output per person engaged | The Conference Board, 2016 | ||
| Knowledge/information and communication technologies (ICT) | Global Innovation Index: Knowledge outputs | AT Kearney/INSEAD, 2016 | ||
| ICT infrastructure | Broadband connections (per population) | World Bank Development Indicators (WDI), 2015 | ||
| Infrastructure | World Bank Logistics Performance Index (LPI) | World Bank, 2014 (from World Bank Logistics Performance Index (LPI) | ||
| Human capital | WEF quality of education | WEF Global Competitiveness Index, 2015-2016 | ||
| Finance | Credit to private sector/GDP | World Bank Development Indicators (WDI), 2015 | ||
| Well-governed | National-level governance [60%] | Quality of public governance [33%] | Regulatory quality indicator | World Bank Governance Indicators, 2015 |
| Government effectiveness | ||||
| Transparency of government policy-making | WEF Global Competitiveness Index, 2015-2016 | |||
| Private property and intellectual property rights protection (composite) | ||||
| Effective checks and balances | ||||
| Political instability (composite) | BEEPS V, 2012, WEF Global Competitiveness Index, 2015-2016 | |||
| Regulatory burden | WEF Global Competitiveness Index, 2015-2016 | |||
| Freedom of media (composite) | Freedom House, 2016, Reporters without Borders, 2016 | |||
| Integrity and control of corruption [33%] | Perception of corruption (composite) | World Bank Governance Indicators, 2015, Transparency International, 2016, BEEPS V, 2012 | ||
| Informality as an obstacle to operations | BEEPS V, 2012 | |||
| Implementation of anti-money laundering/countering the financing of terrorism/tax information exchange standards | International Centre for Asset Recovery, 2015 | |||
| Rule of law [33%] | Judicial independence | WEF Global Competitiveness Index, 2015-2016 | ||
| Effectiveness of courts | BEEPS V, 2012 | |||
| Enforcement of contracts (composite) | World Bank Doing Business, 2016, WEF Global Competitiveness Index, 2015-2016 | |||
| Efficient framework for challenging regulations | WEF Global Competitiveness Index, 2015-2016 | |||
| Rule of law – overall picture | World Bank Governance Indicators, 2015 | |||
| Corporate-level governance [40%] | Corporate governance frameworks and practices [80%] | Structure and functioning of the Board | Legal Transition Team Corporate Governance Sector Assessment, 2016 | |
| Transparency and disclosure (composite) | Legal Transition Team Corporate Governance Sector Assessment, 2016, WEF Global Competitiveness Index, 2015-2016 | |||
| Internal control | Legal Transition Team Corporate Governance Sector Assessment, 2016 | |||
| Rights of shareholders (composite) | Legal Transition Team Corporate Governance Sector Assessment, 2016, World Bank Doing Business, 2016 | |||
| Stakeholders and institutions | Legal Transition Team Corporate Governance Sector Assessment, 2016 | |||
| Integrity and other governance-related business standards and practices [20%] | Ethical behaviour of firms | WEF Global Competitiveness Index, 2015-2016 | ||
| Green | Climate change mitigation [35%] | Physical indicators [35%] | Renewables: Electricity production from renewable sources, including hydroelectric (% of total generation) | World Bank Development Indicators (WDI), 2014 |
| Industry: Value added in industry per unit of industrial CO2 emissions ($GVA/tCO2) | World Bank, International Energy Agency (IEA), 2013 | |||
| Power: MWh consumed per unit of CO2 emissions from electricity and heat generation (MWh/tCO2) | IEA, 2013 | |||
| Buildings: GDP per unit of CO2 emissions from residential buildings (from fuel combustion) ($GDP/tCO2) | World Bank, IEA, 2013 | |||
| Transport: Registered vehicles per unit of CO2 emissions from transport (number of registered vehicles/tCO2) | IEA, WHO, 2013 | |||
| Agriculture: Agricultural gross value added (GVA) per unit of GHG emissions from agriculture ($GVA/tCO2eq) | FAO, World Bank, 2014 | |||
| Structural indicators [65%] | Renewable energy legislation (existence and degree of enforcement) | IEA policy database, latest available | ||
| Intended Nationally Determined Contributions (INDC) rating | World Resource Institute, 2016 | |||
| Carbon pricing | World Bank, International Carbon Action Partnership (ICAP), 2016 | |||
| Fossil fuel subsidies (% of GDP) | IMF, 2015 | |||
| Climate change adaptation [35%] | Physical indicators [35%] | Buildings: Climate risk to infrastructure and buildings | Notre Dame Global Adaptation Index (NDGAIN), 2015 | |
| Water: Aqueduct water stress index | Aqueduct, World Resources Institute, 2015 | |||
| NDGAIN projected change in cereal yield | Notre Dame Global Adaptation Index (NDGAIN), 2015 | |||
| Disaster risk: Disaster risk (% of population exposed to disasters in last two decades) | World Bank Development Indicators (WDI), 2014 | |||
| Structural indicators [65%] | Water pricing | EBRD assessment, latest available | ||
| Agriculture: NDGAIN agricultural capacity | Notre Dame Global Adaptation Index (NDGAIN), 2015 | |||
| Regulatory quality | World Bank, 2013 | |||
| Adaptation mentioned in INDCs | CGIAR, 2015 | |||
| Other environmental areas [30%] | Physical indicators [35%] | Air pollution: population exposed to levels of PM2.5 exceeding WHO guideline | World Bank Development Indicators (WDI), 2014 | |
| Resource efficiency: waste intensive consumption (kg municipal solid waste/ $household expenditure) | Waste Atlas, 2012-2015 | |||
| Waste: waste generation per capita | Waste Atlas, 2012-2015 | |||
| Terrestrial biodiversity (mammal species threatened) | World Bank Development Indicators (WDI), 2014 | |||
| Marine biodiversity (fish species threatened) | ||||
| Structural indicators [65%] | Vehicle emissions standards | United Nations Environment Programme (UNEP), 2016 | ||
| Municipal waste collection coverage (%) | Waste Atlas, 2012-2015 | |||
| Proportion of terrestrial protected area | UNstats, 2014 | |||
| Proportion of territorial seas protected | National Geographic, 2014 | |||
| Number of environmental technology patents | OECD, World Bank, 2013 | |||
| Inclusive | Gender equality | Legal regulations and social norms | Addressing violence against women | The Economist Intelligence Unit – Women’s Economic Opportunity (EIU-WEO) Index, 2012 |
| Property Convention on the Elimination of all Forms of Discrimination Against Women (CEDAW) ratification | ||||
| Sex at birth (f/m ratio) | CIA World Factbook, 2013 | |||
| Early marriage (% of ever married girls, age 15-19) | UN World Marriage, 2012 | |||
| Women’s political rights | Cingranelli-Richards (CIRI) Human Rights Data Project Index, 2011 | |||
| Secure access to land | OECD Social Institutions and Gender Index, 2014 | |||
| Secure access to non-land assets | ||||
| Inheritance laws in favour of male heirs | ||||
| Access to health services | Maternal mortality ratio (maternal deaths per 100,000 live births) | World Bank World Development Indicators (WDI), 2013 | ||
| Contraceptive prevalence (percentage of women aged 15-49) | ||||
| Adolescent birth rate | ||||
| Births attended by skilled health staff (percentage of total) | ||||
| Education and training | Literacy rate (f/m ratio) | UN Social Indicators, 2013 | ||
| Primary school completion rate (f/m ratio) | World Bank World Development Indicators (WDI), 2013 | |||
| Gender parity index (GPI) for gross enrolment rate in secondary education | Education Policy Data Center (EPDC) and World Bank Education Statistics, 2013 | |||
| GPI for gross enrolment in tertiary education | ||||
| Share of female graduates in engineering | United Nations Educational, Scientific and Cultural Organization (UNESCO), 2012 | |||
| Share of female graduates in technology | ||||
| Labour policy | Equal pay policy | The Economist Intelligence Unit – Women’s Economic Opportunity (EIU-WEO) Index, 2012 | ||
| Non-discrimination policy | ||||
| Policy on maternity and paternity leave and its provision | ||||
| Policy on legal restrictions on job types for women | ||||
| Differential retirement age policy | ||||
| CEDAW ratification | ||||
| Labour practices | Equal pay practice | The Economist Intelligence Unit – Women’s Economic Opportunity (EIU-WEO) Index, 2012 | ||
| Non-discrimination practice | ||||
| Access to childcare | ||||
| Gender pay gap | UNECE, 2013 | |||
| Employment and business | Female participation in firm ownership | BEEPS V, 2012 | ||
| Share of women in non-agricultural employment | World Bank World Development Indicators (WDI), 2013 | |||
| Labour force participation rate (f/m ratio, age 15) | ||||
| Unemployment rate (f/m ratio) | ||||
| Employers (f/m ratio) | ||||
| Female share of high-skilled occupations (legislators, senior officials and managers) | ||||
| Employment rate of tertiary educated individuals (f/m ratio) | International Labour Organization, 2013 | |||
| Access to finance | Account at formal financial institution ( f/m ratio, age 15+) | Global Financial Inclusion (Global Findex) Database, 2014 or latest available | ||
| Credit card usage (f/m ratio, age 15+) | ||||
| Mobile phone usage to receive money (f/m ratio, age 15+) | ||||
| Mobile phone usage to send money (f/m ratio, age 15+) | ||||
| The percentage borrowing from formal financial institutions, out of total borrowers (f/m ratio, age 15+) | ||||
| The percentage saving at formal financial institution, out of total savers (f/m ratio, age 15+) | ||||
| Borrowed to start, operate, or expand a farm or business, as share of borrowings (f/m ratio, age 15+) | ||||
| Loans rejected for firms (f/m top management ratio) | BEEPS V, 2012 | |||
| Percentage of firms identifying access to finance as a major constraint (f/m top management ratio) | ||||
| Opportunities for youth | Labour market structure | Hiring and firing flexibility | WEF Global Competitiveness Index, WEF, 2013-14 | |
| Redundancy costs | ||||
| Wage-setting flexibility | ||||
| Labour regulations as a major constraint | BEEPS V and World Bank Enterprise Survey, 2012-14 | |||
| Labour tax and contributions | World Bank Doing Business, 2017 | |||
| Ease of starting a business | ||||
| Youth employment | Difference in unemployment rate from youth (age 15-24) to adult (age 25-65) | World Bank and ILO, 2016 or latest available | ||
| Vulnerable employment rate | ||||
| The share of youth not in education, employment or training (NEET) | ILO-Key Indicators of the Labour Market (KILM), 2016 or latest available | |||
| Vulnerable employment rate | World Bank World Development Indicators (WDI), 2013 | |||
| Youth (aged 15-24) in long-term unemployment: more than 12 months | International Labour Organization, 2014 | |||
| Quantity of education | Average years of education for youth (aged 25-29) | Barro-Lee, 2010 (updated 2015 version); Human Development Index, 2014 | ||
| Percentage of youth (age 15-24) with no schooling | ||||
| Gross graduation ratio tertiary education | UNESCO, 2015 | |||
| Quality of education | PISA test score performance | OECD’s Programme for International Student Assessment (PISA), 2015 | ||
| Employers’ perception of the quality of the education system | WEF Global Competitiveness Index, 2014-15 | |||
| Households’ perception of the quality of the education system | LiTS, 2016 | |||
| Top university ranking | ARWU QS Top University Ranking, 2016 | |||
| Skills mismatch | Skills gap between labour supply and demand (age 15-29) | ILO-KILM, 2013 or latest | ||
| Percentage of over-educated youth (15-29) | ||||
| Percentage of under-educated youth (15-29) | ||||
| Academic unemployment (age 15-29, unemployment rate of youth with tertiary level of education) | ILO, 2014 or latest | |||
| Employers’ perception of skills shortage | BEEPS V and World Bank Enterprise Surveys, 2012-14 | |||
| Financial inclusion | Difference between youth (age 15-24) with bank account compared with adults (age 25+) | Global Findex, 2014 | ||
| Difference between youth (age 15-24) with debit card compared with adults (age 25+) | ||||
| Difference between youth (age 15-24) with bank account used for business purposes compared with adults (age 25+) | ||||
| Percentage of youth saving in a formal financial institution, out of the total number of youth saving | ||||
| Regional disparities | Institutions | Corruption in administrative, health and education systems | LiTS, 2016 | |
| Quality of government services | ||||
| Trust in local government | ||||
| Satisfaction with local government services | ||||
| Access to services | Access to water | LiTS, 2016 | ||
| Access to heating | ||||
| Access to gas | ||||
| Access to computers | ||||
| Access to internet | ||||
| Household’s perception of service satisfaction (electricity and road) | ||||
| Household’s perception of the quality of the health care system | ||||
| Labour markets | Labour market status (worked in the last 12 months) | LiTS, 2016 | ||
| Informal employment (ILO definition) | ||||
| Underemployment | ||||
| Education | Years of education | Gennaioli et al. data set, Quarterly Journal of Economics, 2013 | ||
| Completed education in working age (age 25-65) | LiTS, 2016 | |||
| Household’s perception of the quality of the education system | ||||
| On the job training for permanent employees | BEEPS V and World Bank Enterprise Survey, 2012-14 | |||
| Firms’ satisfaction with workforce education | ||||
| Resilient | Financial stability [70%] | Banking sector health and intermediation [65%] | Capital adequacy ratio | IMF, Fitch, S&P, national central banks, IHS Markit, 2015 |
| Return on assets | ||||
| Loan to deposit ratio | ||||
| Non-performing loans (NPLs) to total gross loans (%) | IMF, national central banks, Fitch, Moody’s, IHS Markit, 2015 | |||
| Loan loss reserves/NPLs | ||||
| Asset share of five largest banks | Bankscope, IMF, 2015 | |||
| Asset share of private banks | ||||
| Assets/GDP | IMF, Bankscope, national central banks, EBRD, 2015 | |||
| Credit to private sector/GDP | World Bank, IMF, S&P, 2015 | |||
| Foreign exchange loans to total loans | IMF, national central banks | |||
| Liquid assets to short term liabilities | IMF, World Bank, national central banks, IHS Markit, 2015 | |||
| Alternative sources of funding [12%] | Other Financial Corporations’ (OFC) assets to GDP | IMF, World Bank, national central banks, 2015 | ||
| Stock market capitalisation | World Bank, IMF, national statistical sources, 2015 | |||
| Regulation, governance and safety nets [24%] | Well-functioning deposit insurance | EBRD assessment, latest available | ||
| Bank risk management capacity and corporate governance | ||||
| Adequate legal and regulatory framework | ||||
| Independent supervisory body | ||||
| Energy sector resilience [30%] | Liberalisation and market liquidity [33%] | Sector restructuring, corporatisation, unbundling | EBRD assessment, latest available | |
| Fostering private sector participation | ||||
| Tariff reform | ||||
| System connectivity [33%] | Domestic connectivity | EBRD assessment, latest available | ||
| Inter-country connectivity | ||||
| Regulation and legal framework [33%] | Development of an adequate legal framework | EBRD assessment, latest available | ||
| Establishment of an independent energy regulator | ||||
| Integrated | Trade (external dimension) [50%] | Trade [33%] | Number of Regional Trade Agreements (RTAs) | WTO, 2015 or latest available |
| Binding overhang ratio (%) | ||||
| Number of non-tariff measures | ||||
| Total trade volume/GDP | UN Comtrade, 2015 | |||
| Foreign direct investment (FDI) [33%] | Number of bilateral investment agreements | UNCTAD, latest available | ||
| Investing across borders score | World Bank, 2012 | |||
| FDI inflows/GDP | IMF, 2015 | |||
| Balance of payments (BoP) openness [33%] | Chinn-Ito Index of measuring financial openness | Chinn-Ito, 2014 | ||
| Non-FDI inflows/GDP | IMF, 2015 | |||
| Infrastructure (internal dimension) [50%] | Cross-border infrastructure [25%] | Logistics performance index | World Bank, 2016 | |
| Cost of trading across borders | World Bank Doing Business, 2015 | |||
| Domestic infrastructure quality [25%] | Logistics Performance Index (LPI) components for service delivery | World Bank, 2016 | ||
| Global Competitiveness Index (GCI) Quality of railways | WEF Global Competitiveness Index, 2015-2016 | |||
| GCI Quality of airports | ||||
| GCI Quality of roads | ||||
| GCI Quality of ports | ||||
| Energy [25%] | GCI Quality of electricity supply | WEF Global Competitiveness Index, 2015-2016 | ||
| Losses due to electrical outages (% of annual sales) | World Bank Enterprise surveys, latest available | |||
| Information communications technology [25%] | Level of competition for internet services | World Bank, 2015 | ||
| Broadband penetration | WEF Global Competitiveness Index, 2015-2016 |
Subscribe to the EBRD Transition Report 2017-18 mailing list.
Sign up to receive important announcements and emails about the Transition Report.